


In the dynamic landscape of modern manufacturing, mastering the art of data utilization is key to achieving peak production performance. Effective data reporting is crucial to empowering decision-makers with actionable insights to improve operations, use resources efficiently, and encourage innovation. In this guide, we explore the common challenges encountered by manufacturers in data reporting and highlight how effective reporting solutions enhance productivity and efficiency.
Data reporting challenges in manufacturing
Data security and privacy
Manufacturers struggle with security risks like cyberattacks, the intricacies of cloud storage, and privacy concerns and obligations inherent to third-party data. Unsuccessfully addressing these challenges can lead to a significant disruption of operations, a decline in product quality, and a damaged brand reputation.
Data fragmentation
Data fragmentation poses a significant obstacle to reporting in manufacturing. Data is scattered across different systems, applications, and storage locations, leading to difficulties in accessing and utilizing data effectively. This fragmentation hinders the ability to collect and merge all the necessary data for reports.
Scalability
Scalability in data reporting for manufacturing involves the reporting solution’s ability to handle increasing data volumes as operations expand. If the reporting tools and systems can’t keep pace with the data, it leads to bottlenecks, delays, and inefficiencies in reporting processes and production.
Interpretation and visualization
Effective visualization and interpretation are ever-present challenges in manufacturing data reporting because they are designed to present very dense information in a way that is easily understandable. When visualizations are cluttered or awkward, decision-makers can take away misguided or incorrect points.
Collaboration
Collaboration challenges in data reporting obstruct communication, transparency, and data access across departments and teams in an organization. These challenges take many different forms and lead to inconsistencies, incomplete data sets, and a lack of data sharing.
How reporting solutions address data reporting challenges in manufacturing
A reporting solution provides a structured framework for reporting and a set of tools to extract, process, analyze, and present data. Here are several ways a reporting solution tackles reporting challenges unique to the manufacturing industry:
Seamless data integration: Reporting solutions integrate data from multiple sources, allowing users to consolidate all manufacturing data in one place for comprehensive analysis. This integration leads to better decision-making regarding production scheduling and inventory management.
Customizable reporting options: Customization is essential to overcoming data reporting challenges in manufacturing environments. With it, you can tailor insights, streamline reporting, and create reports that deliver the specific visualizations and data filters you need.
Automation capabilities: Automation tackles manufacturing data reporting challenges by boosting efficiency, accuracy, and compliance. It minimizes human error, ensures timely and accurate reports, and streamlines the reporting process, reducing reliance on manual intervention and avoiding potential delays.
Visualization and user-friendliness: Visualization and user-friendliness play a crucial role in addressing the challenges of data reporting in manufacturing by enhancing the clarity, accessibility, and effectiveness of data communication. By creating visually friendly reports that are easy to understand, decision-makers can grasp complex information quickly and make informed decisions based on accurate data.
Manufacturing KPIs for reports
Here are some sample manufacturing KPIs visualized using the Bold Reports reporting solution:
Production variance
The following KPI Is used in the manufacturing industry to track the difference between targeted and actual production. It assists manufacturers in pinpointing periods when they met or missed production goals, and helps them investigate and rectify inefficiencies or adjust production plans accordingly.
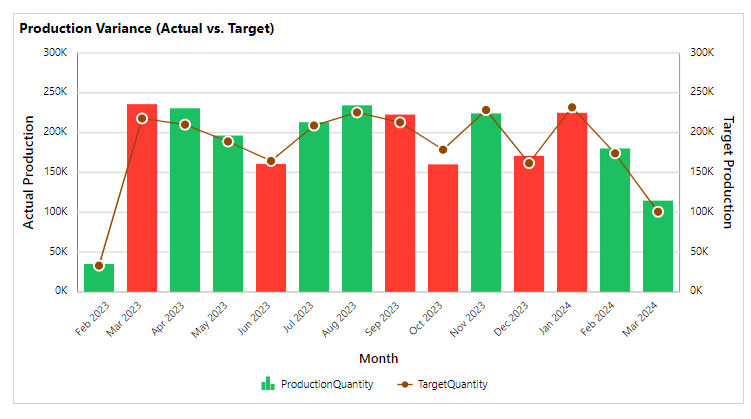
Production Variance (Actual vs. Target) Chart
Top 5 machines by production volume
The following KPI is used in production to identify which machines contribute the most to the overall output. This identification helps manufacturers know which machines need to be prioritized for maintenance and upgraded to improve their efficiency.
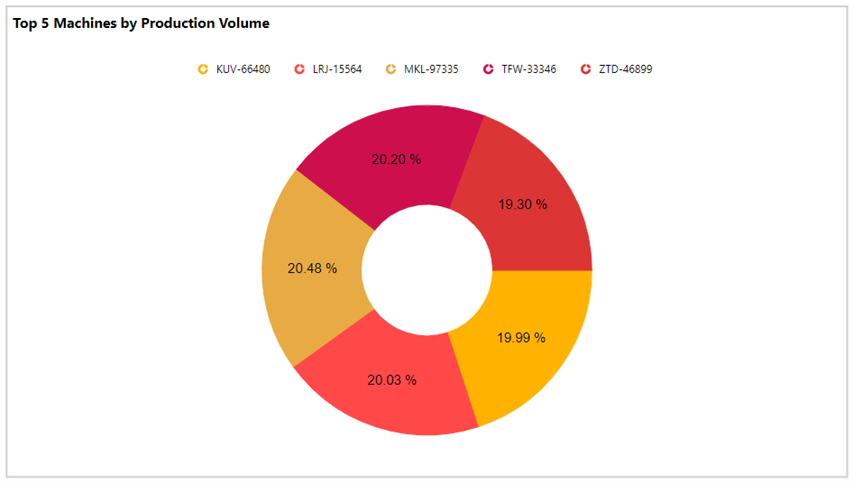
Top 5 Machines by Production Volume Chart
Cost analysis over time
This KPI is used in the manufacturing industry to track changes in production costs over time. By visualizing this data, manufacturers can identify trends and potential areas for cost reduction.
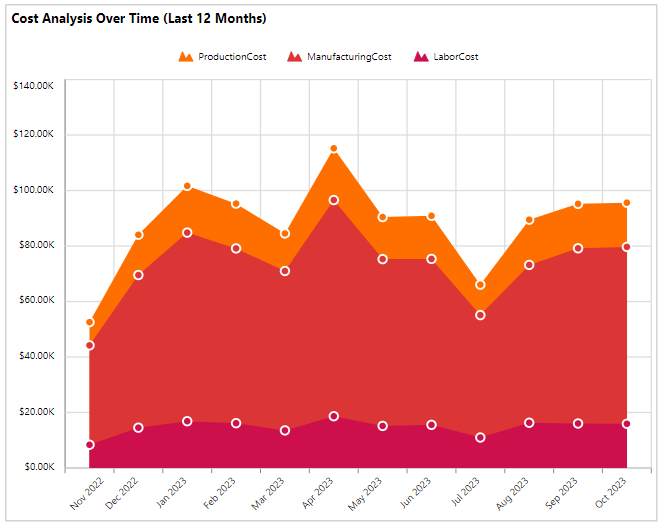
Cost Analysis Over Last 12 Months Chart
Bold Reports is a comprehensive reporting solution that addresses the challenges of data reporting in manufacturing detailed in this blog. It also offers report management options like auto draft, versioning, publish, and mark as public to streamline the reporting process. These help manufacturers save time in designing and sharing reports.
Conclusion
Reports give manufacturers invaluable insight that they can leverage to optimize processes and drive continuous improvement in their production. With advanced visualization capabilities, collaborative features, and adaptability, Bold Reports revolutionizes reporting in manufacturing environments.
If you have any questions, please post them in the comment section below. We welcome you to start a free trial and experience Bold Reports. Let us know what you think!