Five Design Tools for Creating Appealing Reports Using Bold Reports

Reports are important for your business because they help people make smart decisions, keep track of progress, and share important info. But making these reports can be hard and take a lot of time, especially if you don’t have the right tools.
Bold Reports makes this job way easier. It helps you create reports fast. In this blog, we’re going to share five design tools in Bold Reports that let you design effective reports. These tools will help you make your reports quickly and efficiently.
Layout Ordering
When you’re using Bold Reports, it’s like arranging things neatly on a poster. Imagine you have different things to put on the poster, like papers and photos. You want to put them in the right order, so it looks good and makes sense.
In Bold Reports, it’s similar. You have different parts in your report, and you need to organize them in the right order. This way, your report will be easy to read and understand. So, the first set of tools to use lets you put things in the right order in Bold Reports to make your reports look nice and clear.
Bold Reports offers several ordering modes.

Send Backward: Moves the selected object behind its closest intersecting object.

Bring Forward: Moves the selected object visually over its closest intersecting object.
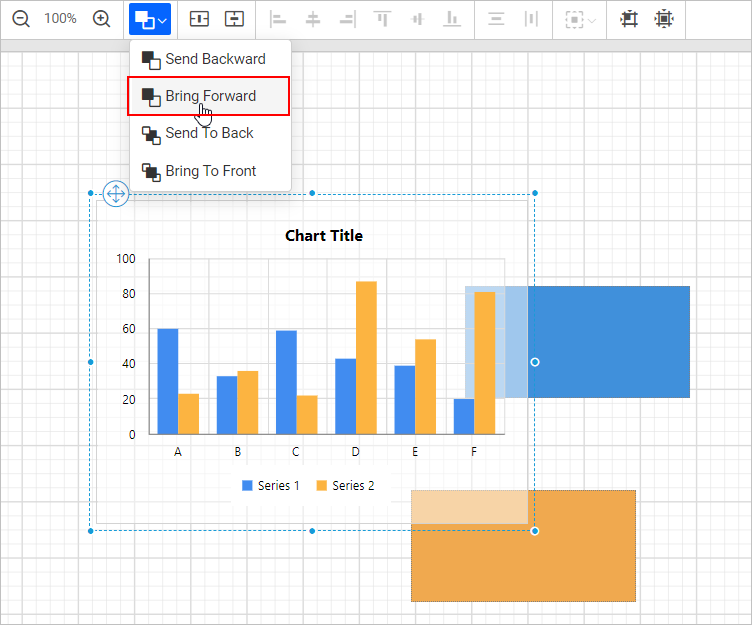
Send To Back: Visually moves the selected object behind all other intersecting objects.

Bring To Front: Moves the selected object visually over all other intersecting objects, ensuring it takes the spotlight.

Alignment
When you’re creating your report, you want everything to line up correctly. Bold Reports gives you the power to ensure all your text, numbers, and pictures are straight and orderly. This way, when someone reads your report, everything looks tidy and organized. This second set of tools is all about making sure everything lines up perfectly in your reports, making them look polished and easy to follow.
In the following images, you can see the different alignment in Bold Reports.
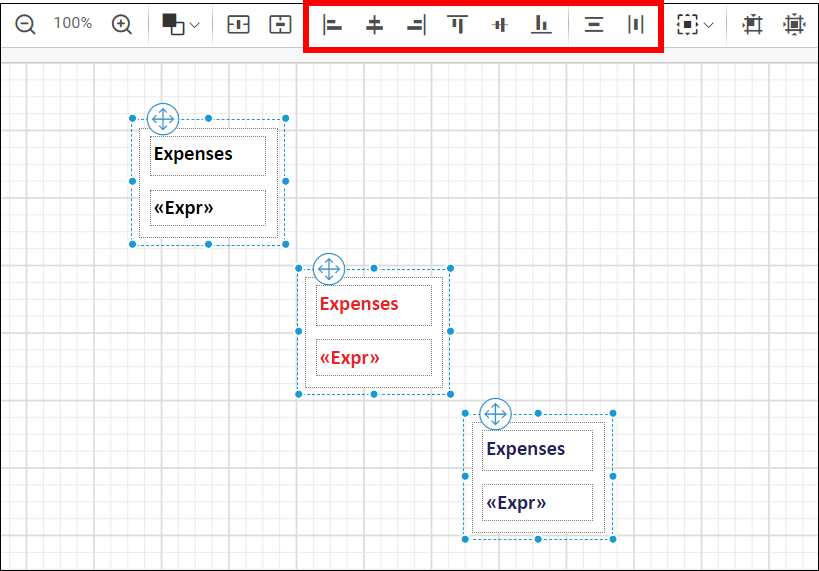
Left Align: The selected items are aligned to the left based on the report item that has the left-most position value among the selected report items.

Center Align: The selected report items are aligned to the center based on the left-most and right-most positions of the selected report items.

Right Align: The selected items are aligned to the right based on the report item that has the right-most position value among the selected report items.

Top Align: The selected items are aligned to top based on the report item that has the top-most position value among the selected report items.

Middle Align: The selected report items are aligned to the middle based on the top-most and bottom-most positions of the selected report items.

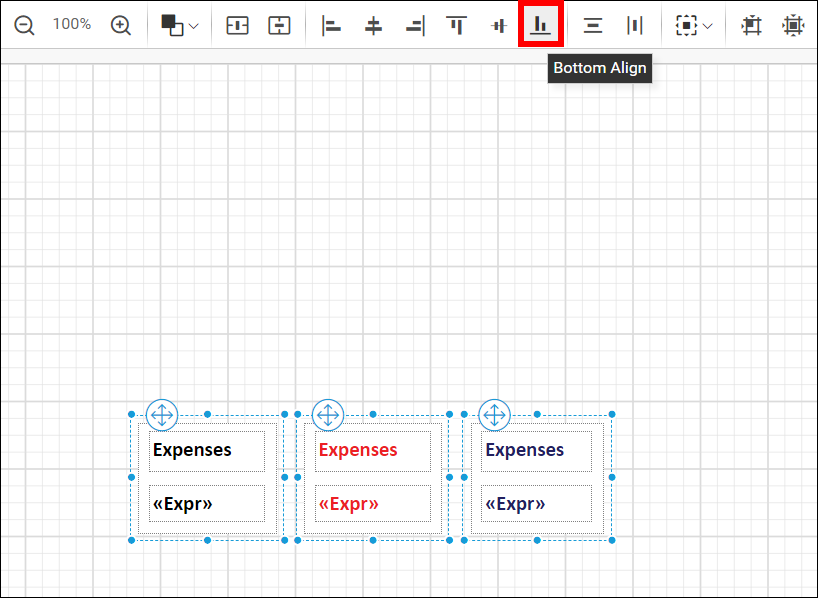
Bottom Align: The selected items are aligned to the bottom based on the report item that has the bottom-most position value among the selected report items.
You can align elements both horizontally and vertically.
Center horizontally: Aligns the selected report items to the center of the design surface or parent container horizontally.

Center vertically: Aligns the selected report items to the center of the design surface or parent container vertically.

Distribute
Think of your report like a cake, and you have different toppings to decorate it, like fruit and chocolates. You don’t want all the fruits piled up in one place, right? You want them evenly spread out to make the cake look yummy and balanced.
In Bold Reports, taking care of distribution is like making sure your report’s decorations (like text boxes and images) are evenly spaced. It’s like placing those yummy cake toppings in a balanced way. This tool lets you make your report visually appealing by spacing elements out evenly. Just like a well-decorated cake, a well-distributed report is pleasing to the eyes!
The Distribute option can be used to place the selected report items with equal spacing both horizontally and vertically.
The following images illustrate the concept of distribution.

Horizontal: The horizontal option distributes the report items in the design surface with equal intervals horizontally.
Before:

After:

Vertical: The vertical option distributes the report items in the design surface with equal intervals vertically.
Before:

After:

Sizing
Imagine you have different-sized puzzle pieces. To complete your puzzle, you need to make sure each piece fits into its place perfectly. The sizing in Bold Reports is similar. Your report elements, like charts and images, come in different sizes.
Sizing is all about adjusting these elements so they fit well together, just like puzzle pieces. You can make things bigger or smaller to create a balanced and harmonious report layout. It’s like making sure all the pieces of your puzzle fit snugly, creating a clear and cohesive picture in your report. This helps you make your reports visually pleasing and easy to understand.
The sizing options are:
Same size
Same height
Same width

The following images visually illustrate the Bold Reports sizing options, showing how different elements can be adjusted proportionally.
Same Size: Resizes the width and height of the selected report items to the size of the first selected report item.

Same Width: Resizes the width of the selected report items to the width of the first selected report item.

Same Height: Resizes the height of the selected report items to the height of the first selected report item.

Align to Grid and Size to Grid
Aligning to grid in Bold Reports means placing your report elements inside the boxes of the design surface’s grid, making everything line up neatly. It’s like arranging toys in a toy box so they don’t spill over.
Sizing to grid is making sure your report elements are just the right size to fit inside these grid boxes. So, the fifth tool you should us is the grid to organize your report elements. By aligning and sizing them properly, you ensure your report looks neat and tidy, making it easy for anyone to read and understand.
The following images illustrate aligning elements to the grid and sizing them to the grid, demonstrating how objects can be precisely arranged and resized within a grid-based layout system.
Align To Grid:

Size To Grid:

Conclusion
This blog explored five design tools in Bold Reports to make your reports look their best. To explore further, go through our Bold Reports documentation. To experience the features live, check out our demo samples.
If you have any questions, please post them in the comments section. You can also contact us through our contact page, or if you already have an account, you can log in to submit your support question.
Bold Reports offers a 15-day free trial with no credit card information required. We welcome you to start a free trial and experience Bold Reports. Be sure to let us know what you think!
Stay tuned for announcements about new releases by following us on our Twitter, Facebook, and LinkedIn pages.


