Create Your First RDLC Report Using our Designer

In a real-time scenario, it is a common requirement to analyze client-side custom business objects or data from an application. The report definition language client-side (RDLC) report was introduced to serve this purpose. It allows you to bind and analyze your local business objects or .NET data sets without using any data connectors.
In this blog, we will explain how to create your first RDLC report using the Bold Report Designer.
Prerequisites
Standalone Report Designer installation.
Create RDLC data set
First launch the Bold Reports RDLC Designer from your Windows Start menu or desktop shortcut.
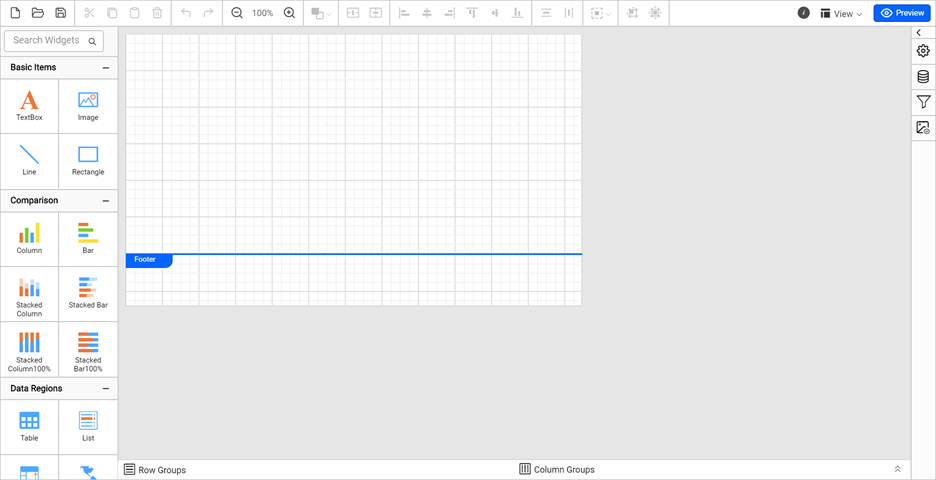
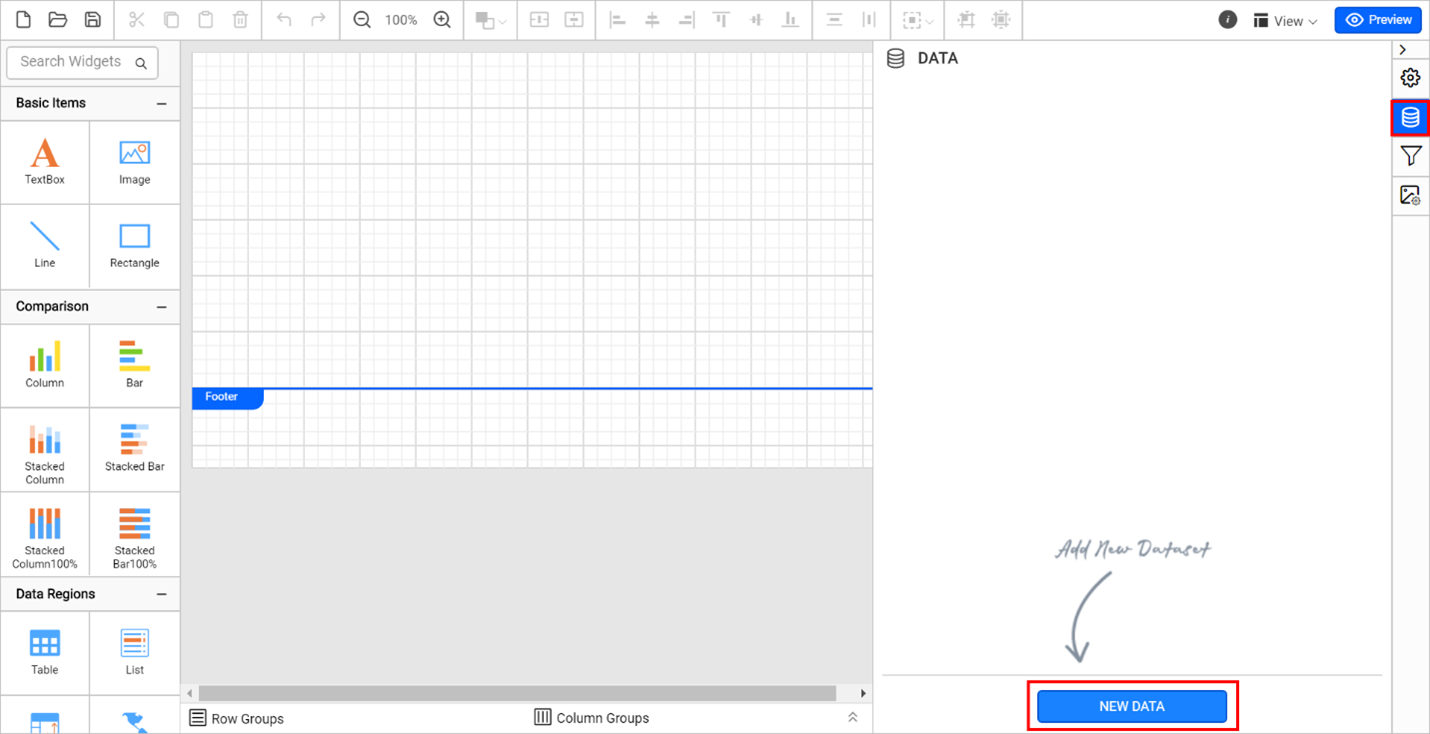
Click the Data icon in the Report Designer to open the data configuration pane.
In the data pane, click the NEW DATA option to create a new data set for your RDLC report.
Change the data set name to Sales for this report.
Add the required data fields with the appropriate data types. Here, we added the data fields ProductCategory, SubCategory, OrderYear, OrderQtr, and Sales with proper data types individually.
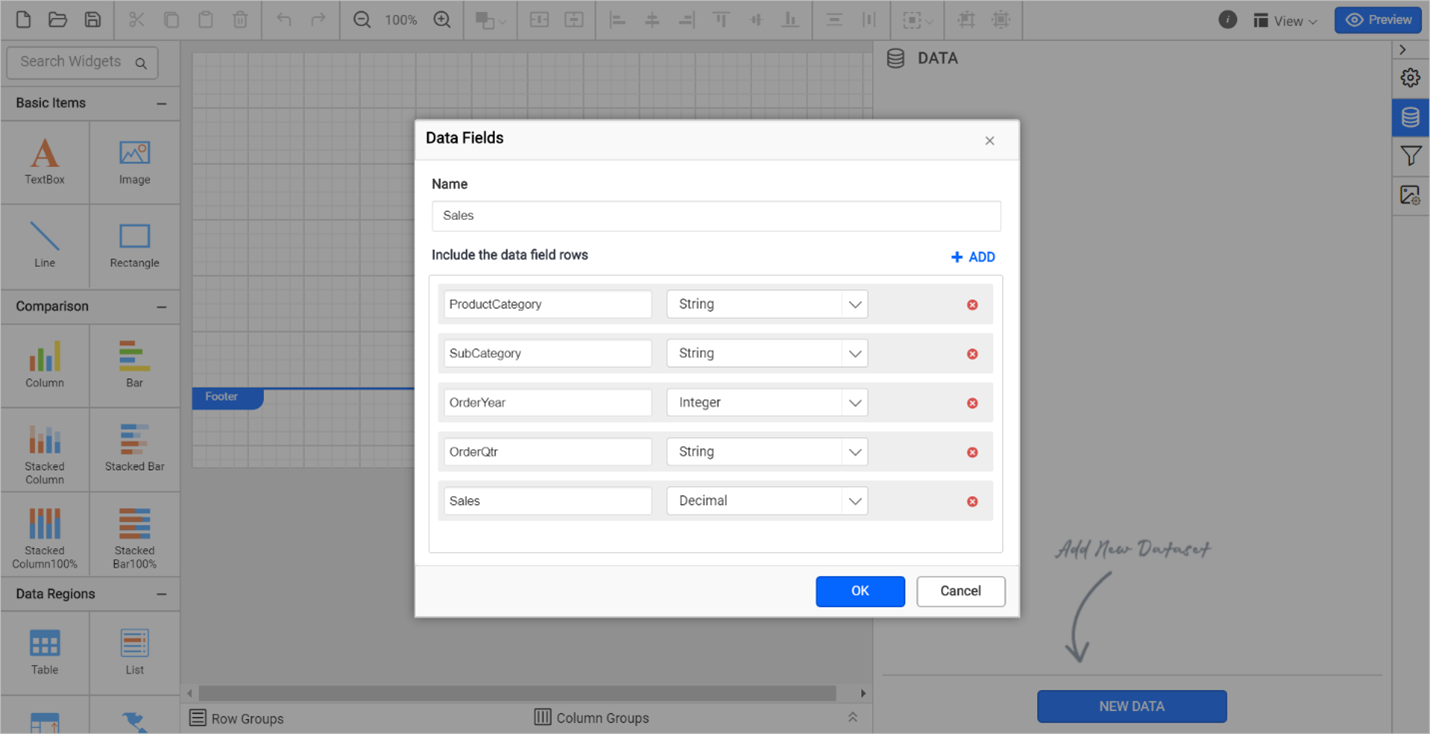
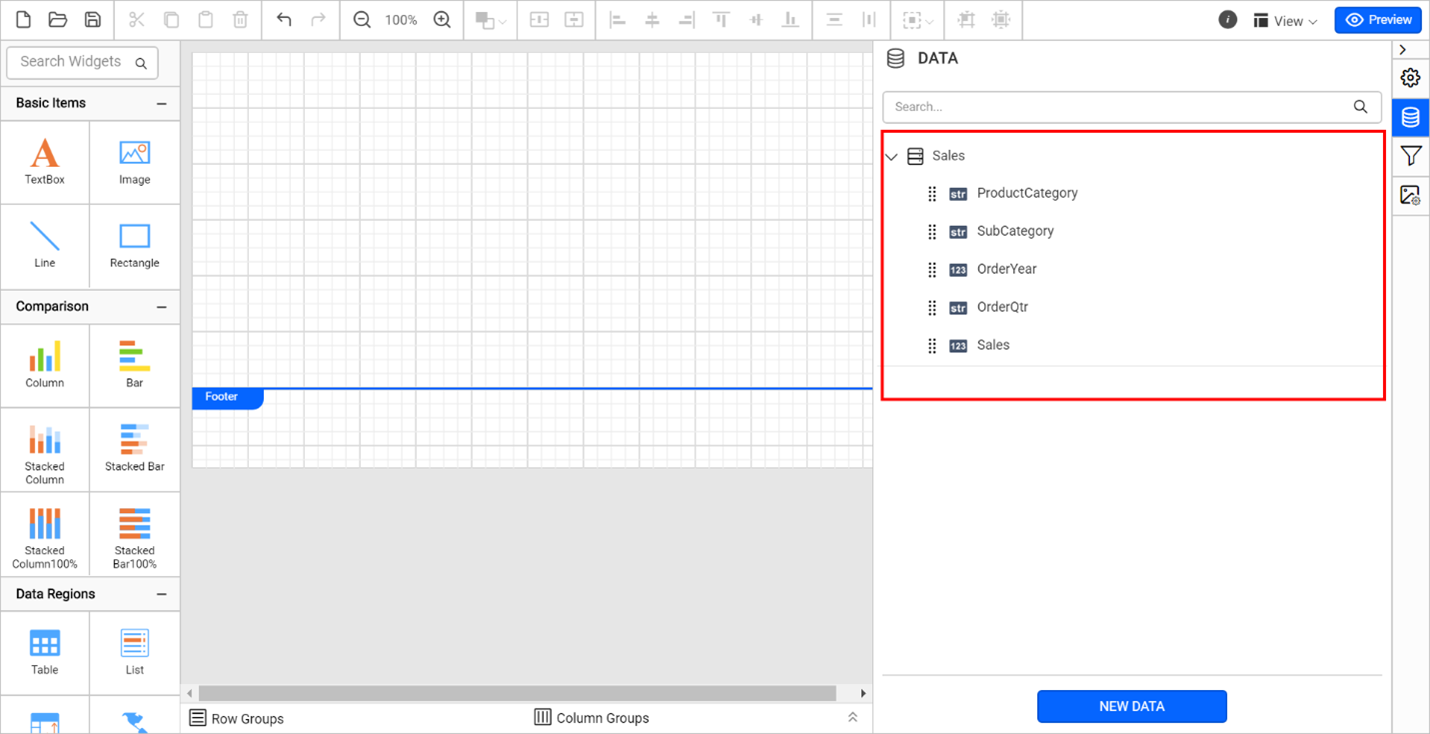
After adding the required data fields, click OK. Created fields are displayed under the Sales data set in the data pane. Now the data set is ready to add in tables or visuals to the RDLC report.
Add report items to the design
Add a table to the report
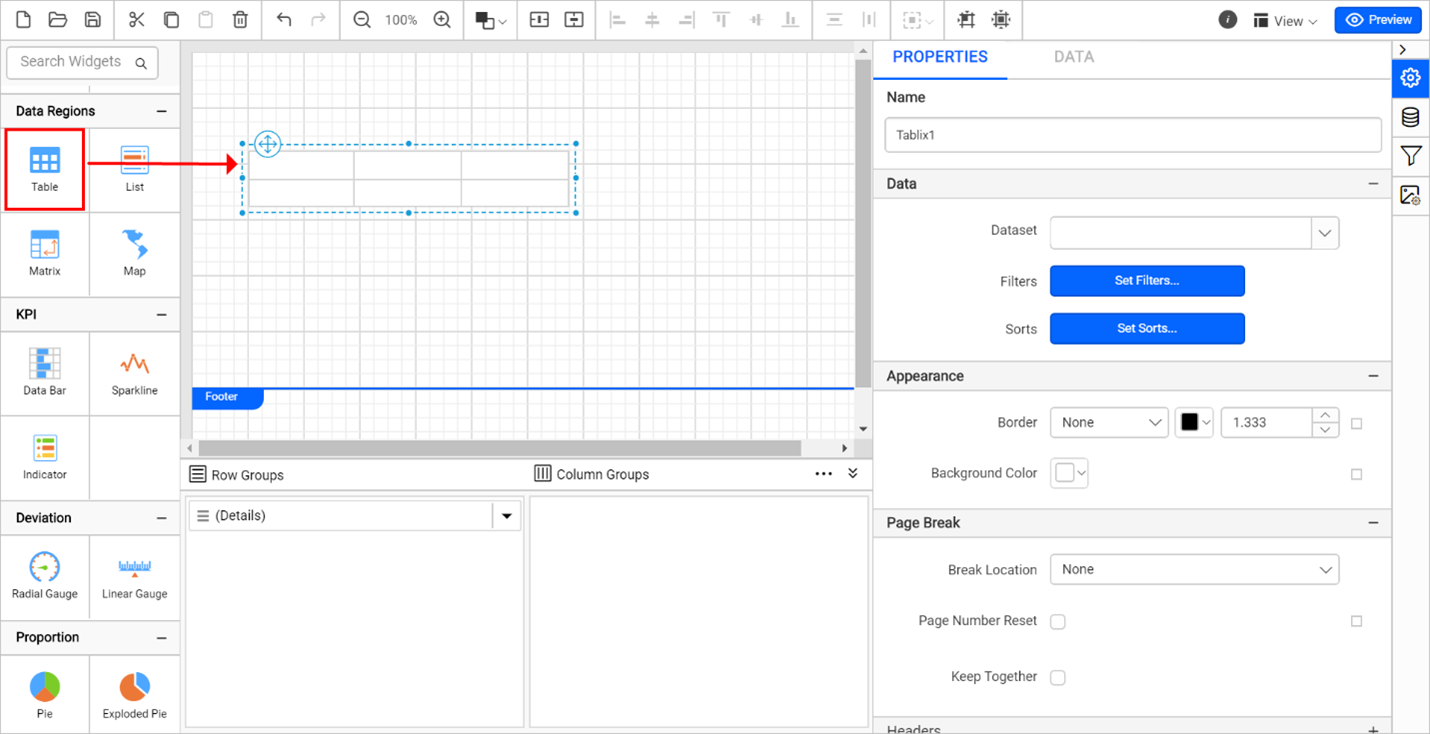
First, let’s add a table to the design surface by dragging a table report item from the items pane.
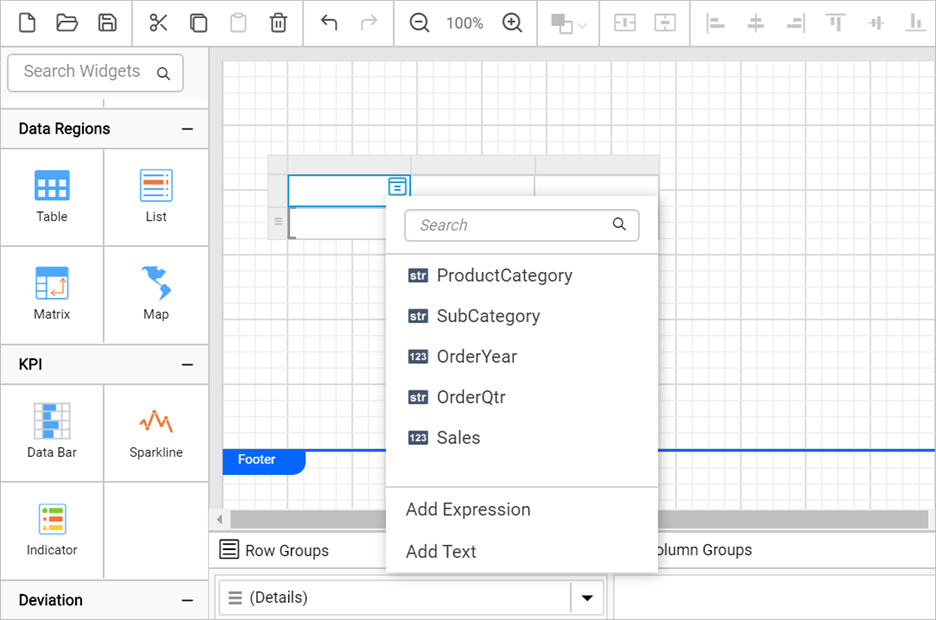
Select the table cell and click on the Data assign menu icon to open the menu. Select the Add Text option.
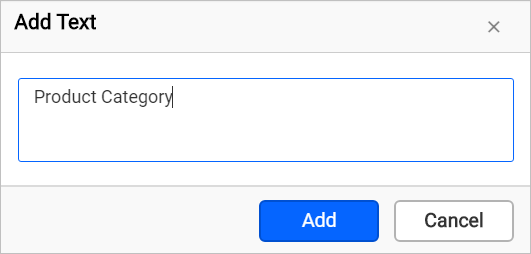
Enter Product Category in the text area and click Add.
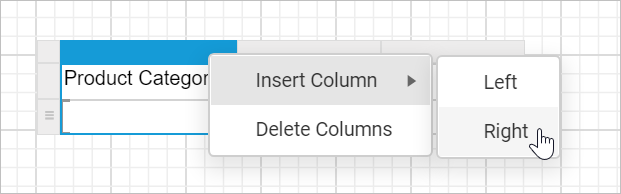
Select a column and right-click on the column gripper. Then insert a new column to the right of the current one.
Similarly, add columns and set the headers Sub Category, Order Year, Order Qtr, and Sales.
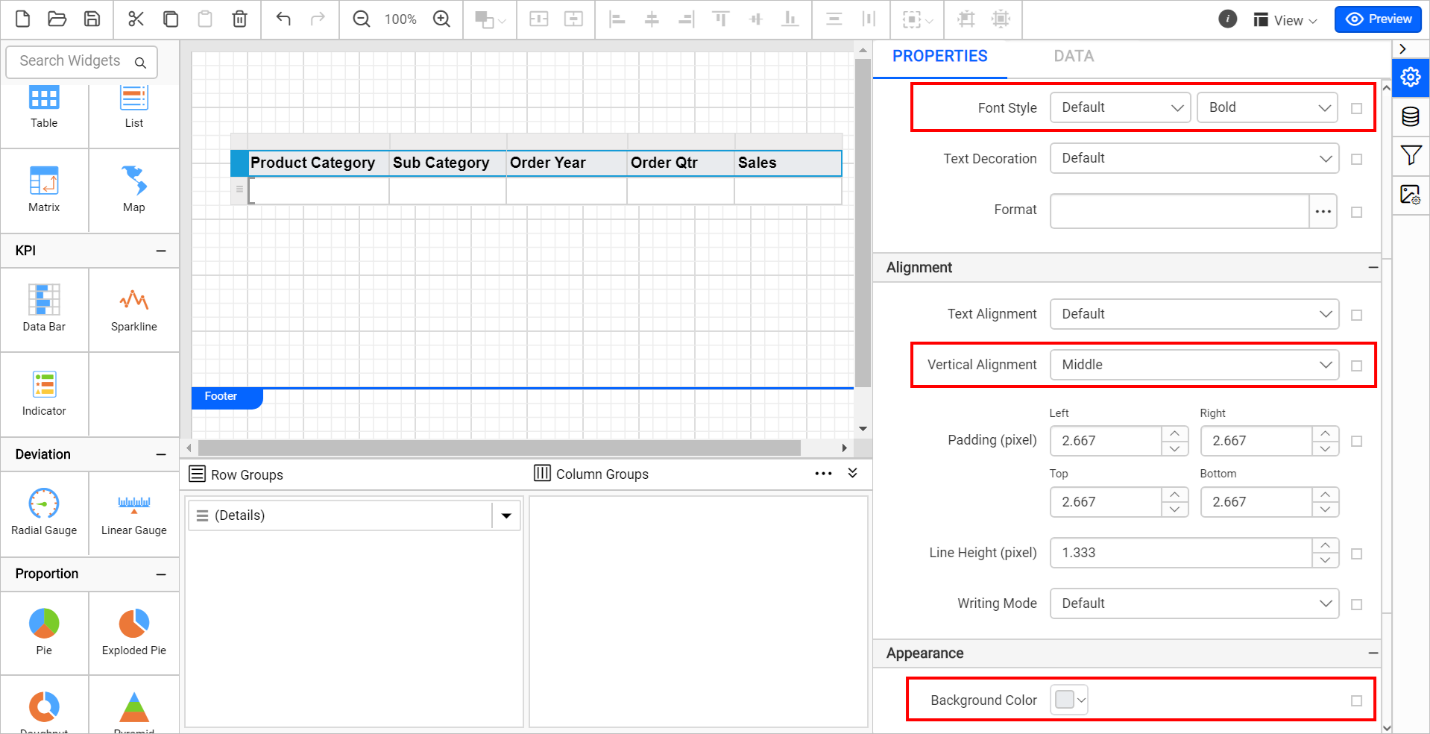
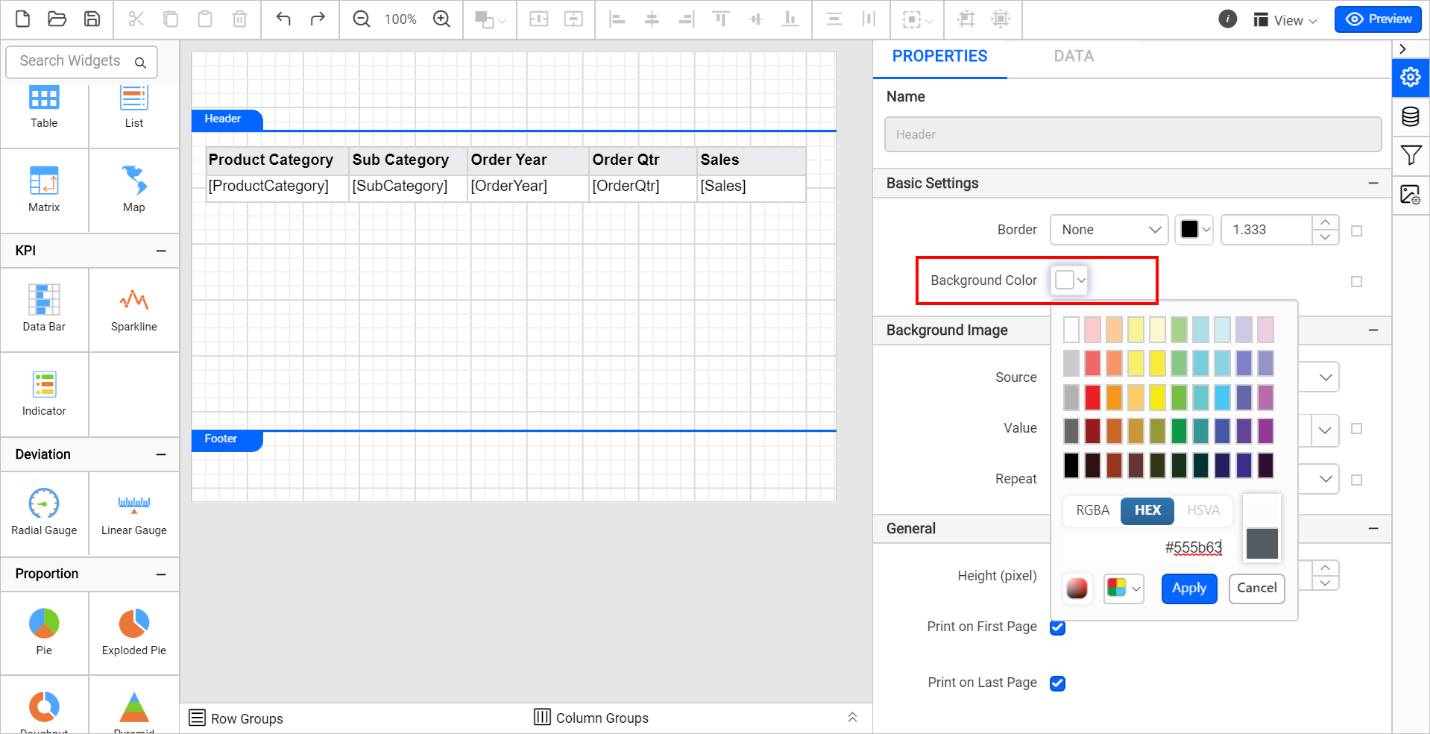
To customize the table header appearance, click on the header row gripper. The properties panel shows the common properties of header cells. Change the background color by opening the color picker.
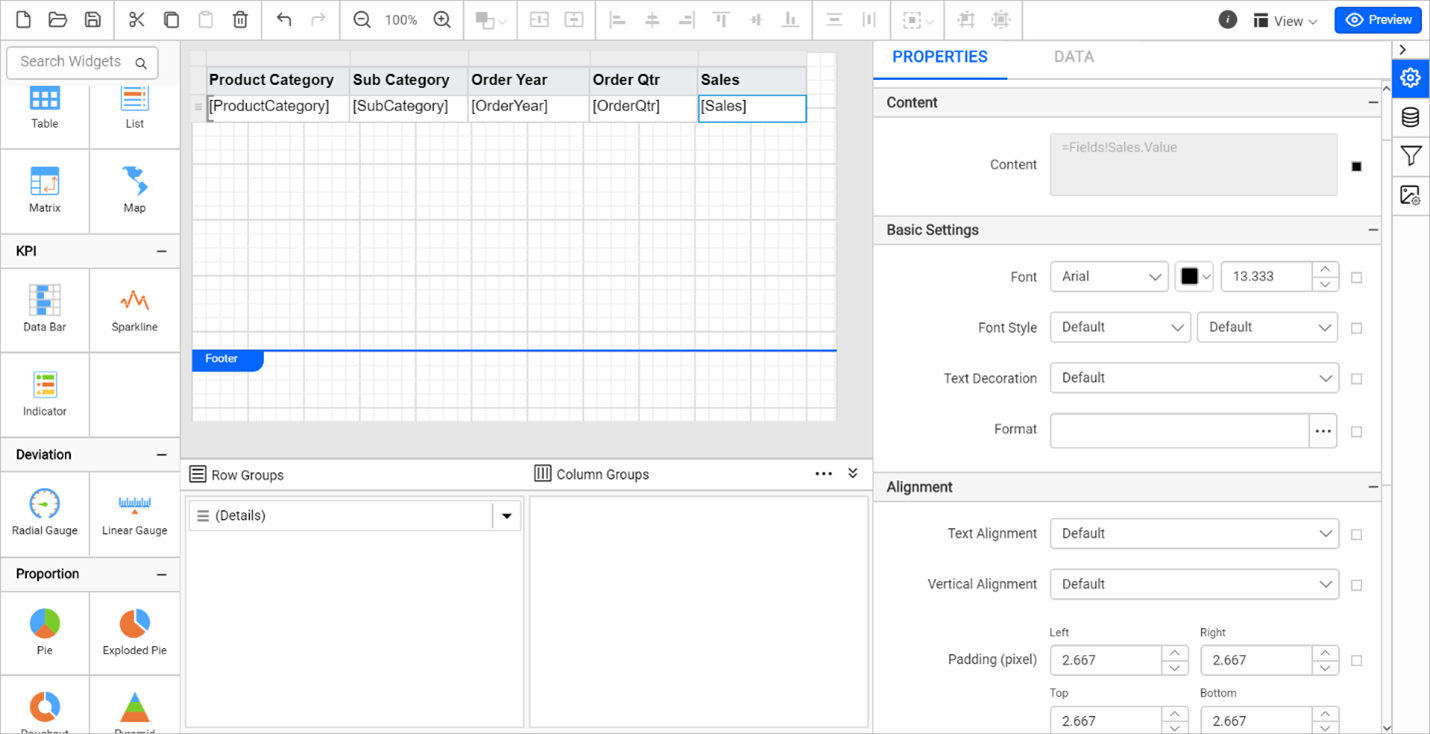
Select the body cell and click the Data assign icon to open the data assign menu.
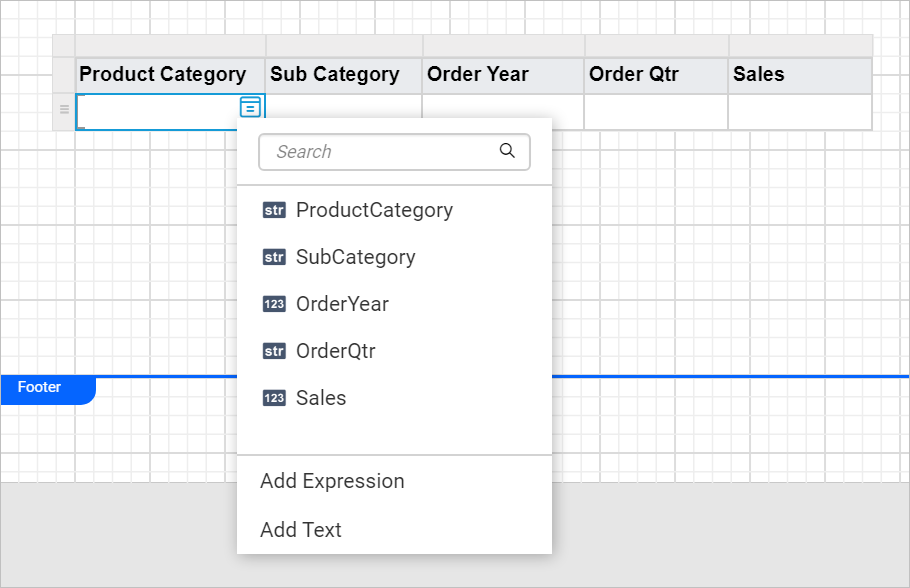
Choose the required data fields for each cell. Refer to the assign data documentation to learn more.
Add report header
We are also going to add a header to the RDLC report:
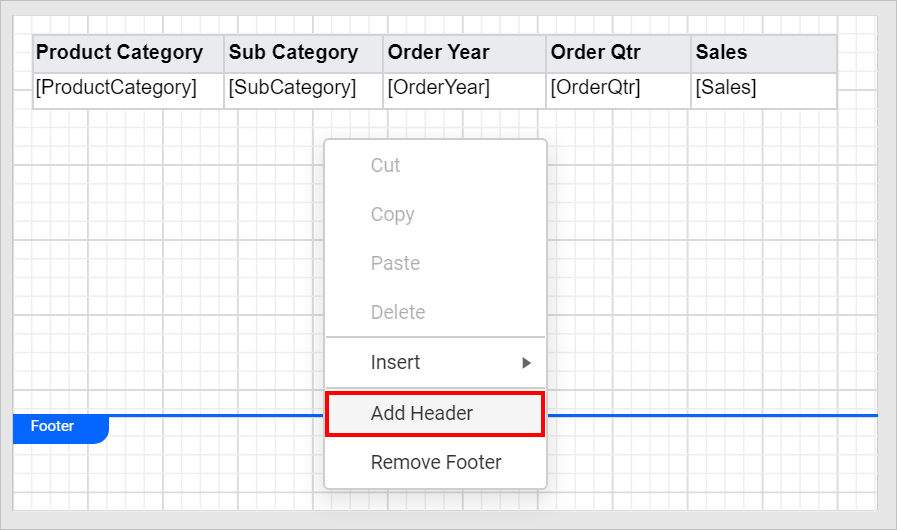
Right-click on the design surface and select Add Header.
Click the header section and change the background color in the properties pane.
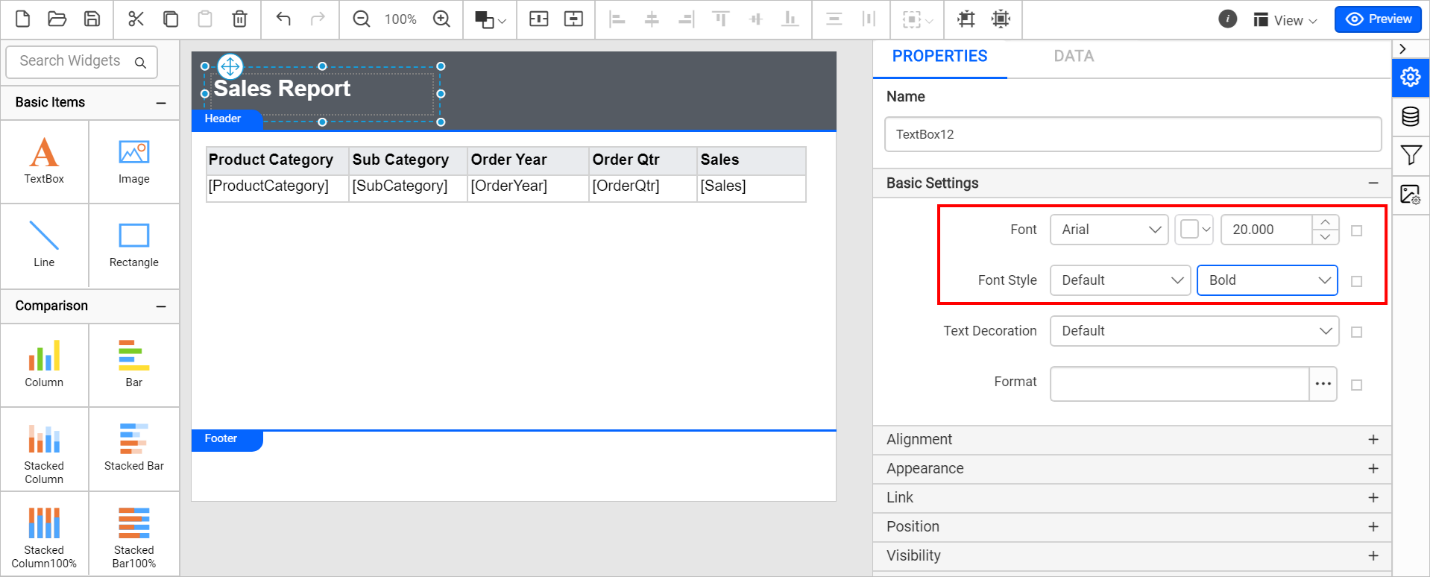
Drag the TextBox report item to the header section and input the title text.
Select the TextBox item and change the font properties like size and color in the properties pane.
Input the JSON data and view the RDLC report
As you already know, the RDLC report does not contain any data connectors. So, we are going to pass JSON data input to preview the report and verify whether it displays what you require.
JSON (JavaScript object notation) is a lightweight data-interchange format. It is easy for machines to parse and generate. Let’s do the following steps to preview and verify the report output
Click Preview at the top-right corner of the toolbar to open the Preview Data pop-up as in the following.
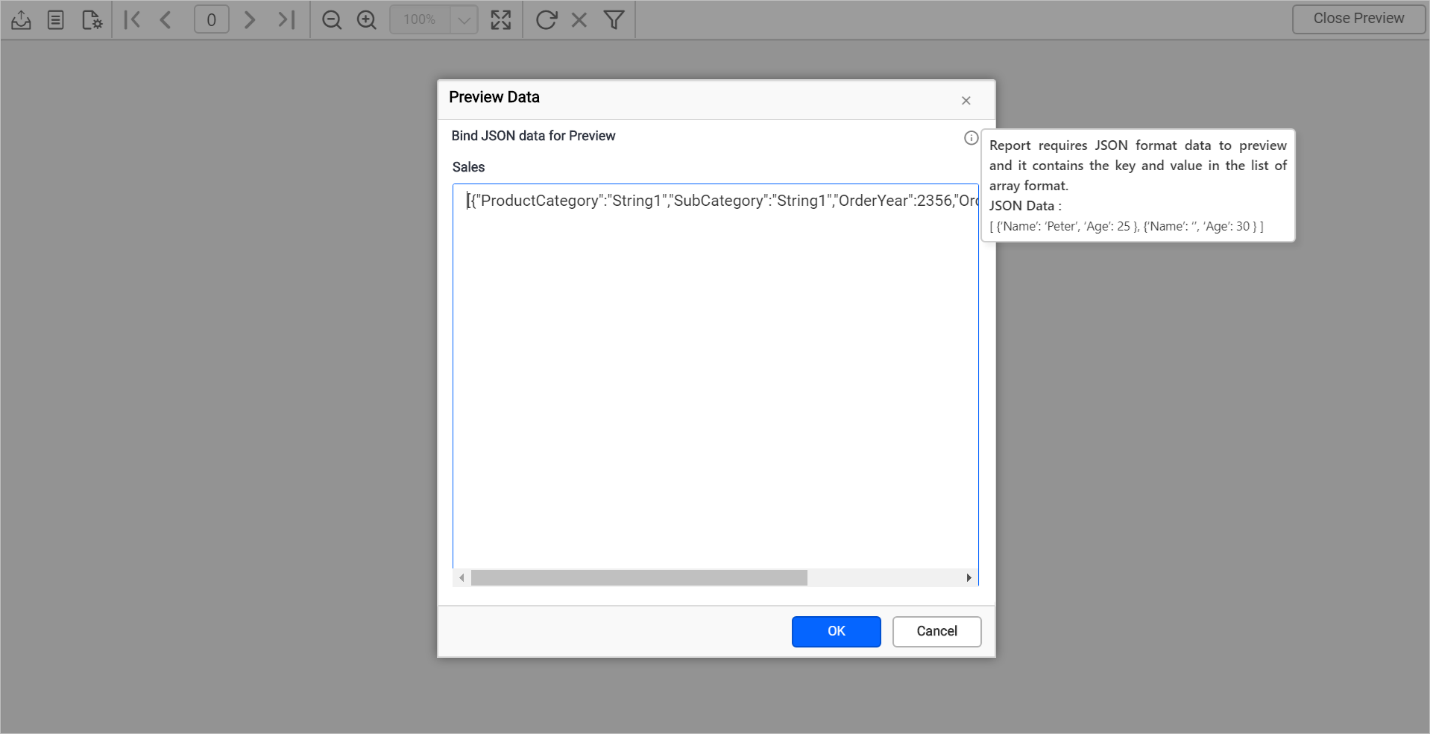
Clear the existing sample text and input your JSON array collection or copy and paste the following JSON data.
The key names in the input JSON array should be the same as the data field name given in data set creation.
[{"ProductCategory": "Accessories", "SubCategory": "Helmets", "OrderYear": "2002", "OrderQtr": "Q1", "Sales": 4945.6925},
{"ProductCategory": "Components", "SubCategory": "Road Frames", "OrderYear": "2002", "OrderQtr": "Q3", "Sales": 957715.1942},
{"ProductCategory": "Components", "SubCategory": "Forks", "OrderYear": "2002", "OrderQtr": "Q4", "Sales": 23543.1060},
{"ProductCategory": "Bikes", "SubCategory": "Road Bikes", "OrderYear": "2002", "OrderQtr": "Q1", "Sales": 3171787.6112},
{"ProductCategory": "Accessories", "SubCategory": "Helmets", "OrderYear": "2002", "OrderQtr": "Q3", "Sales": 33853.1033},
{"ProductCategory": "Components", "SubCategory": "Wheels", "OrderYear": "2002", "OrderQtr": "Q4", "Sales": 163921.8870},
{"ProductCategory": "Bikes", "SubCategory": "Road Bikes", "OrderYear": "2003", "OrderQtr": "Q2", "Sales": 4119658.6506},
{"ProductCategory": "Clothing", "SubCategory": "Socks", "OrderYear": "2003", "OrderQtr": "Q3", "Sales": 6968.6884},
{"ProductCategory": "Bikes", "SubCategory": "Road Bikes", "OrderYear": "2003", "OrderQtr": "Q4", "Sales": 3734891.6389},
{"ProductCategory": "Components", "SubCategory": "Mountain Frames", "OrderYear": "2002", "OrderQtr": "Q3", "Sales": 608352.8754}]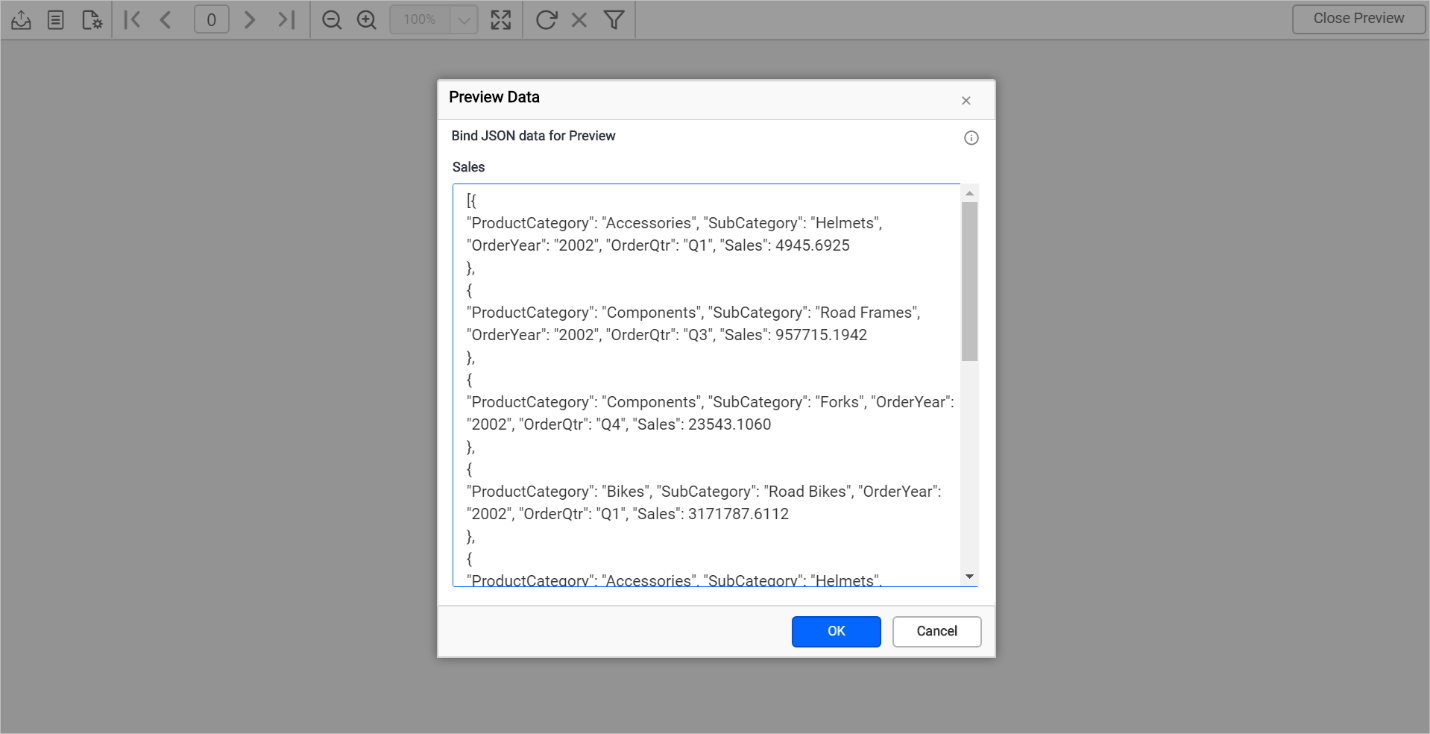
Click OK in the Preview Data dialog, and the report displays as in the following image.
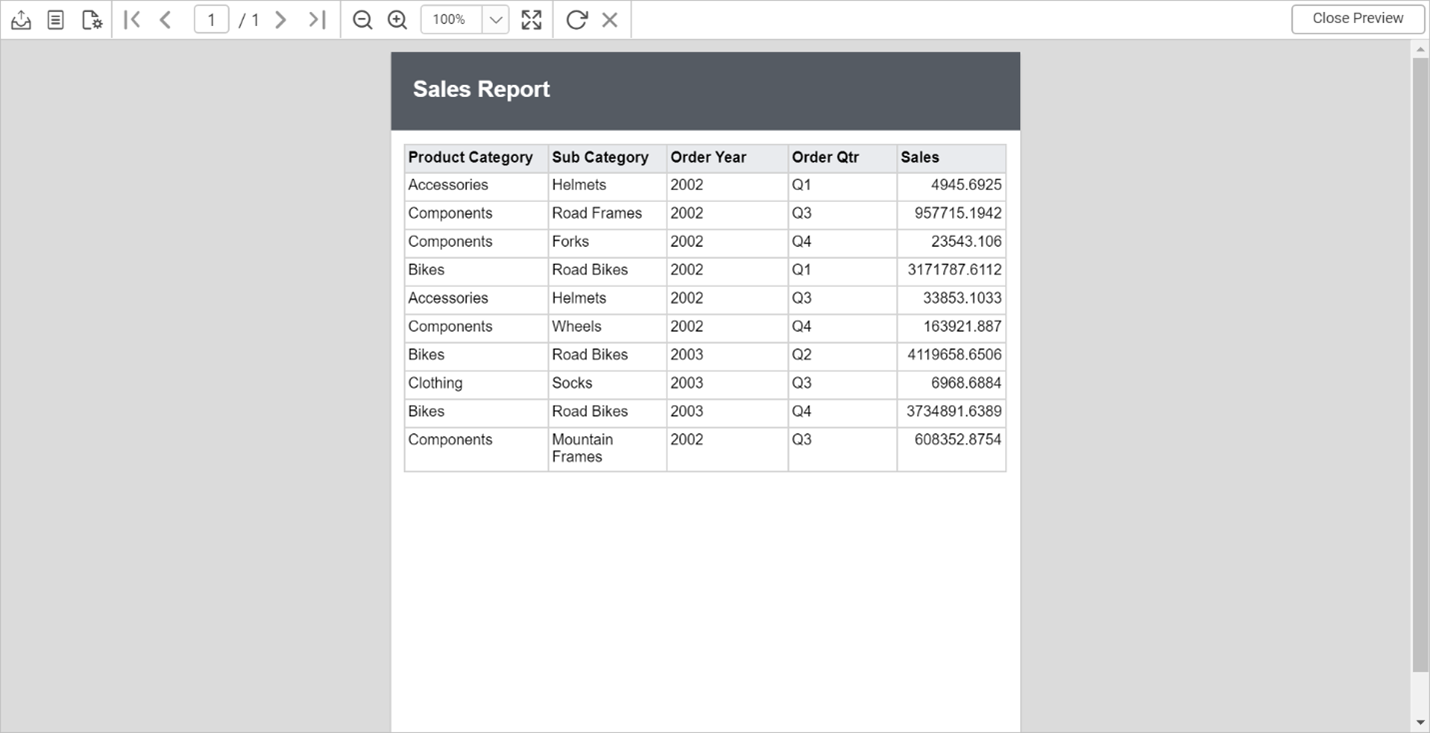
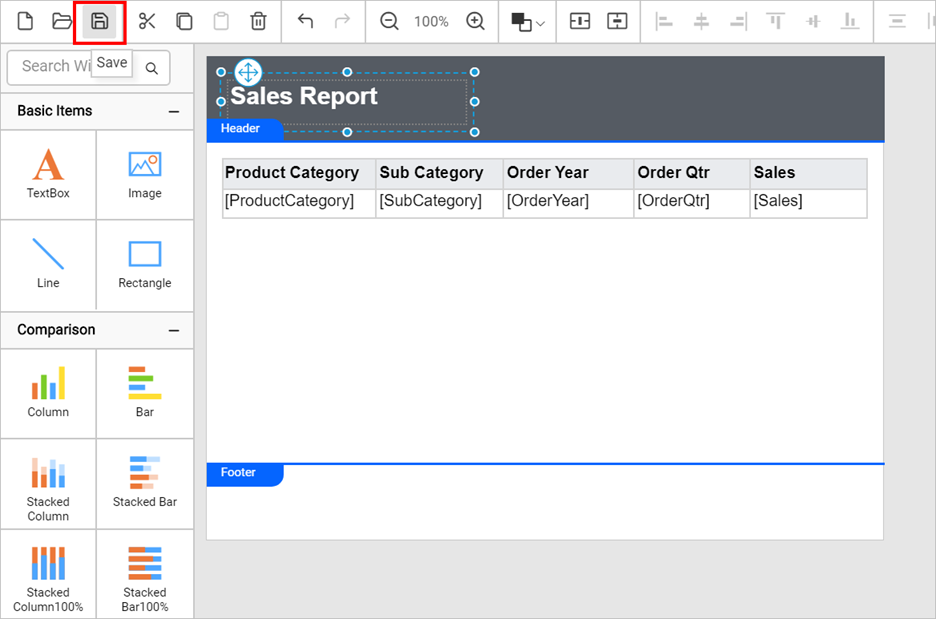
Click Close Preview. Select the save icon in the toolbar to save a copy of the report design to your local machine.
Refer to the documentation for instructions on how to view, print, and export the already created RDLC report inside your application by binding business object data, custom local objects, and data sets.
Conclusion
In this blog, we have learned how to create a simple RDLC report and display data in a table report item using Bold Reports®. To explore further, we recommend you go through our documentation. We have also attached the created sales-report.rdlc report for your reference.
If you have any questions, please post them in the comments section below. You can also contact us through our contact page or, if you already have an account, you can log in to submit your support question. Feel free to check out the Bold Reports Embedded Reporting demos and documentation to explore the available tools and their various customization features.
Bold Reports now comes with a 30-day free trial with no credit card information required. We welcome you to start a free trial and experience Bold Reports for yourself. Give it a try and let us know what you think!
Stay tuned to our official Twitter, Facebook, LinkedIn, Pinterest, and Instagram pages for announcements about new releases.


