How to Connect PostgreSQL Data to RDL Using Bold Reports

TL;DR: If you’re exporting PostgreSQL data to spreadsheets or manually building reports, you’re creating unnecessary work in your reporting process. By connecting PostgreSQL directly to an RDL report in Bold Reports®, you can automate report generation and deliver structured, reusable outputs without any manual data handling.
Introduction
PostgreSQL powers a wide range of operational and transactional systems, but the data it stores is often too raw for business users to interpret effectively. Tables, rows, and basic query outputs don’t provide the clarity needed for reporting or decision‑making.
As teams try to bridge this gap, they frequently run into familiar obstacles, such as:
Exporting CSV files and manually cleaning or formatting them.
Re‑creating the same SQL logic across different reports.
Producing numbers that don’t match because each team calculates metrics differently.
Struggling to distribute updated reports quickly.
Rebuilding visual layouts whenever underlying data changes.
These challenges gradually slow down reporting processes and create unnecessary friction. What organizations need is a reliable reporting layer that connects directly to PostgreSQL and produces consistent, reusable report outputs, without all the manual effort.
In this blog, we’ll walk through how to set up a PostgreSQL data source in Bold Reports, configure the connection string, create datasets, and preview your report with live data.
Why use RDL for PostgreSQL reporting?
PostgreSQL stores valuable business data, but in its raw form it’s hard for most stakeholders to interpret because tables don’t tell a story unless the data is organized, summarized, and presented in a consistent format. Connecting PostgreSQL to an RDL report in Bold Reports turns that raw data into a structured, visual report that’s easy to read, easy to share, and easier to act on. This transformation adds value in the following ways:
Creates pixel-perfect reports with full control over layout and formatting.
Handles grouping, filtering, parameters, and calculations with ease.
Reuses the same report across development, testing, and production environments.
Supports enterprise needs like security and large data volumes.
Connects PostgreSQL and even combines it with multiple data sources if required.
Uses a standard, reliable report format that is widely adopted and future-ready.
Next, let’s explore how designers and developers can connect PostgreSQL data to an RDL report in Bold Reports step by step.
How to connect PostgreSQL data to an RDL report
Connecting PostgreSQL data to an RDL report in Bold Reports helps you pull live database records directly into your report design, so you can build tables, groups, and summaries without relying on manual exports. This makes it easier for you to keep reports accurate, refresh data on demand, and deliver a consistent view of the latest information to everyone who relies on the report. To connect the PostgreSQL data source in Bold Reports, follow these steps:
Launch the Bold Reports Designer from the Windows Start menu or its desktop shortcut.
Select the Data icon on the right to create a new data source with a PostgreSQL.
In the DATA configuration panel, click on the NEW DATA button.
Select PostgreSQL data source type from the list. A PostgreSQL connection configuration window will open, allowing you to enter the server’s name, port, database name, username, and password.
Test the connection to ensure the credentials and server details are correct and then save the data source.
Next, create a dataset for the report query, then design the layout using tables, charts, and other report items.
Once the data source and dataset are configured correctly and you’ve designed a report, you can preview the report and confirm that your PostgreSQL data renders properly. The following image illustrates the visualization of sales data, showing unit price by product.

Connecting to PostgreSQL data
Next, let’s discuss how to schedule, share, and collaborate on RDL reports built using PostgreSQL data to ensure stakeholders can work together effectively and always receive timely updates.
Scheduling RDL reports in Bold Reports
Bold Reports lets you schedule your RDL reports that use PostgreSQL data so that reports run and are delivered automatically at the time you choose.
You can automate report generation and delivery on a daily, weekly, or monthly basis, ensuring consistent and timely access to the latest insights. To configure scheduling, follow the step-by-step guide provided in our blog Schedule Business Reports, our documentation, or the steps shown in the following animation.

Collaborate and share RDL reports using Bold Reports
Log in to the Bold Reports Designer using your preferred login method and then click a report’s Share option in the report listing page.
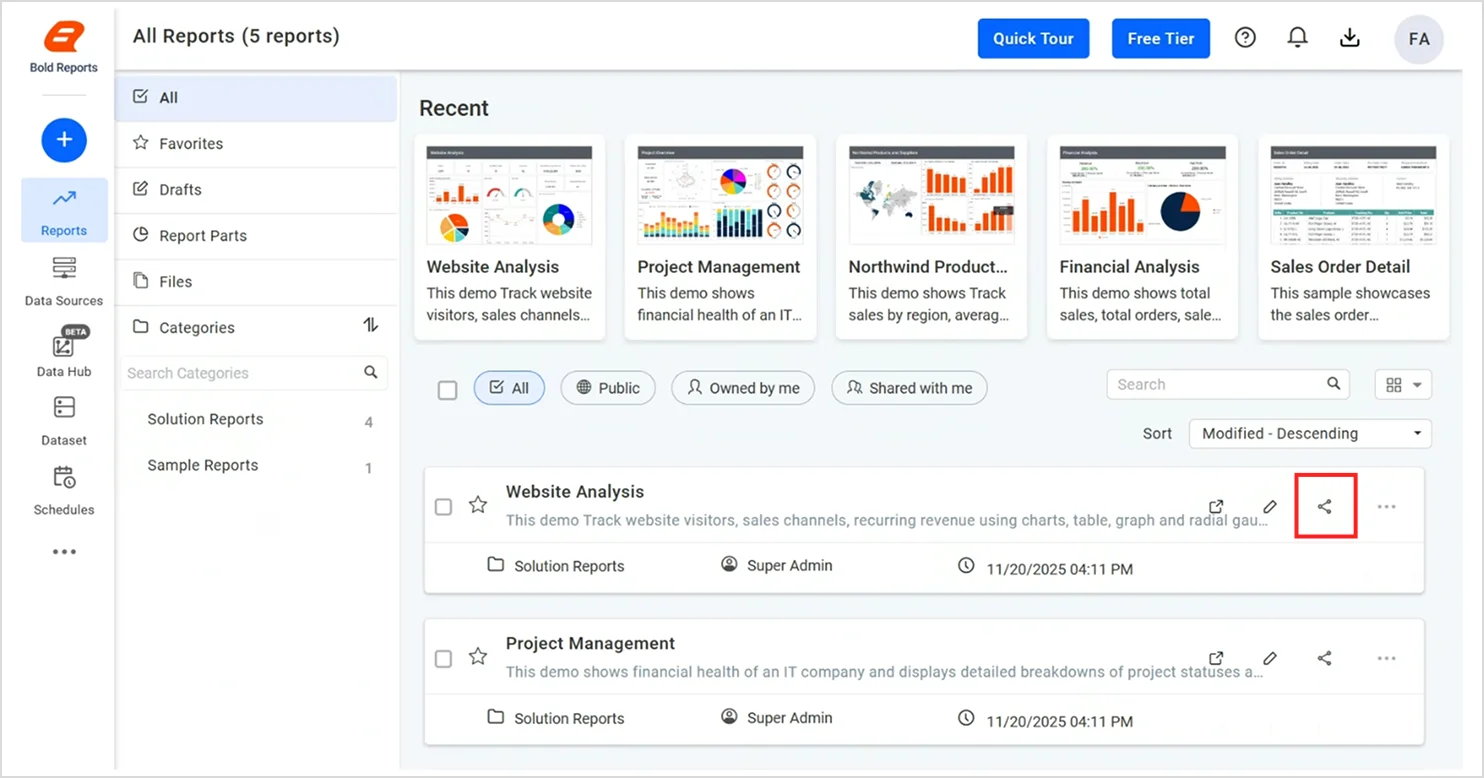
In the Share with others window, click Manage Access.
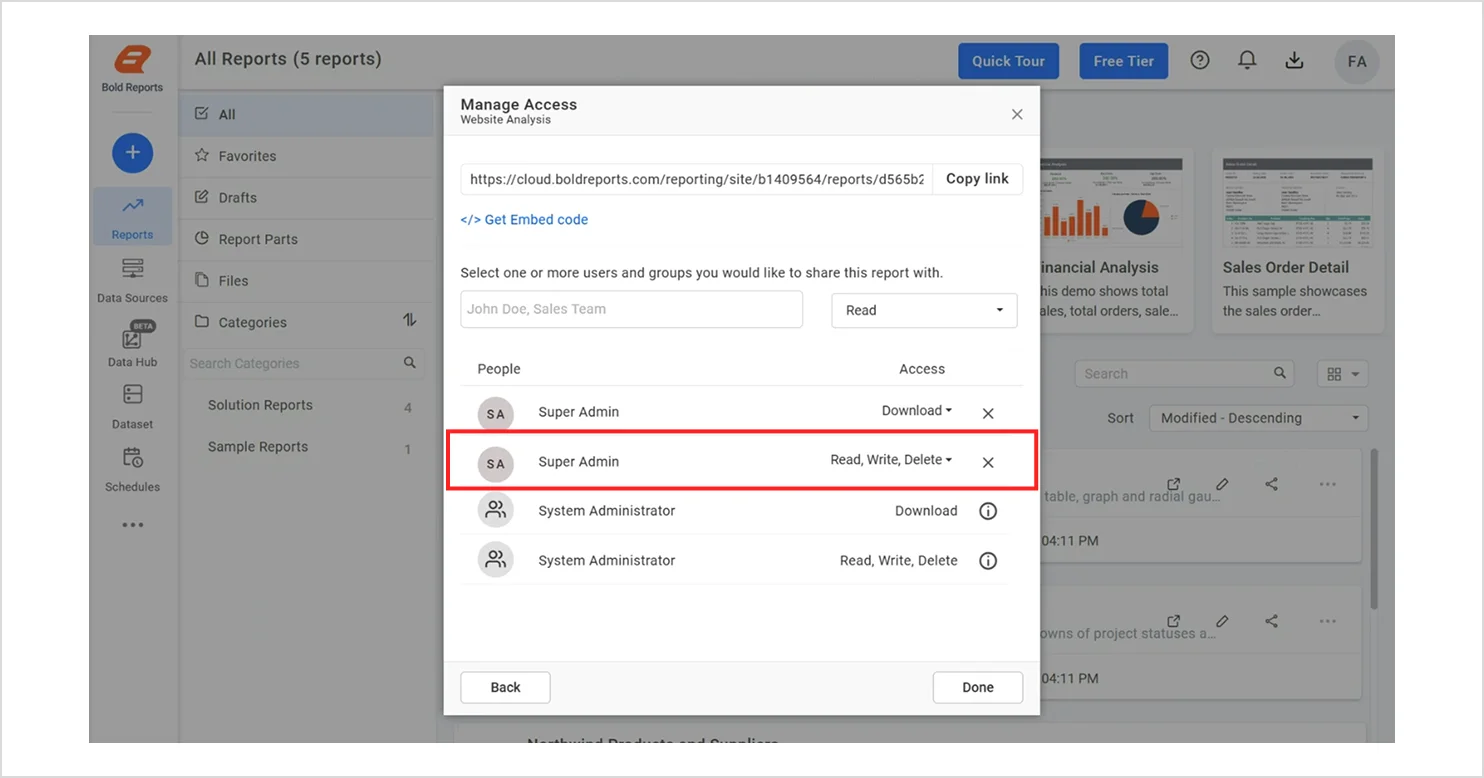
Manage access
Select the permission level (for example: Read, Read/Write, Read/Write/Delete, or Download) and choose the users or groups you want to share the report with.
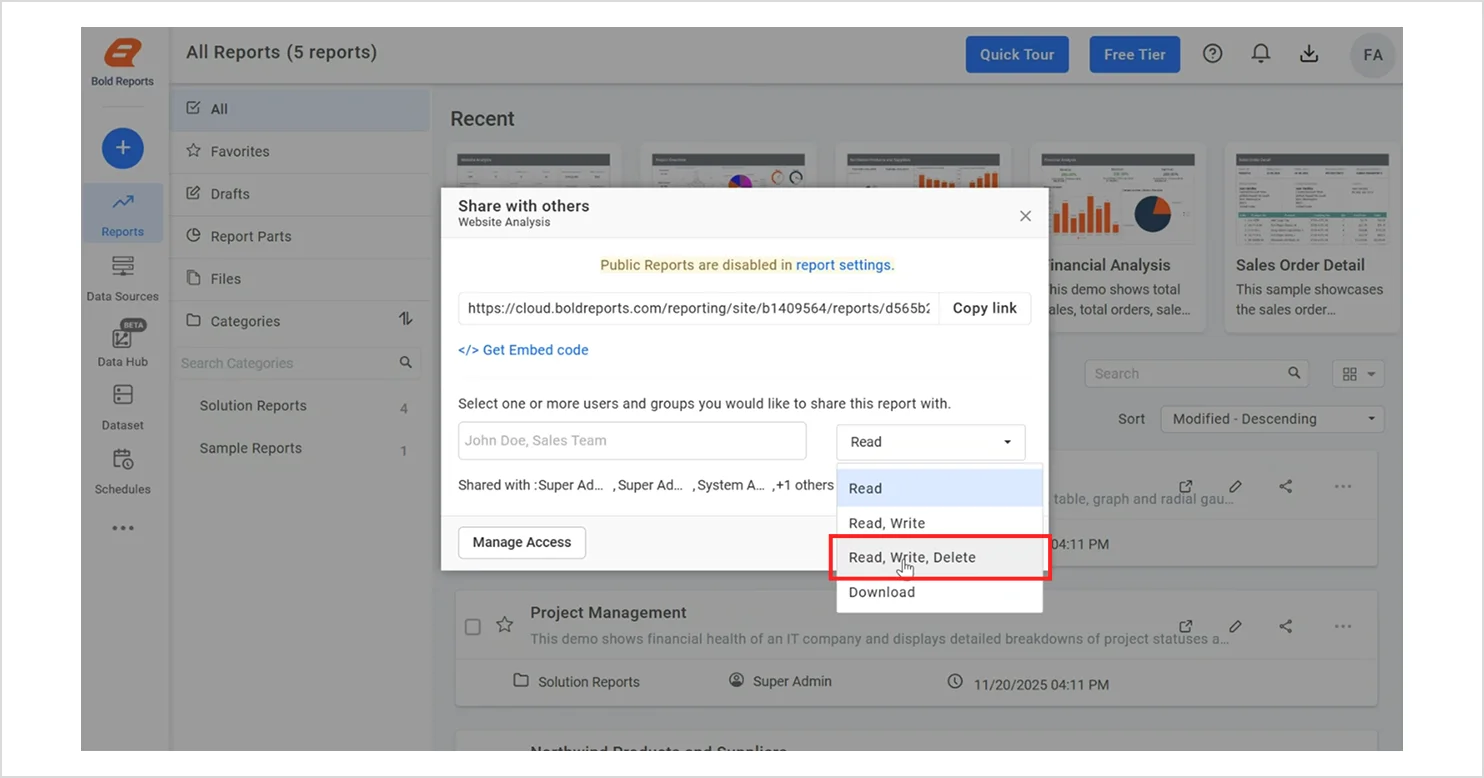
Read, write, delete option
Click Add to grant access, then click Done to save and apply the sharing settings.
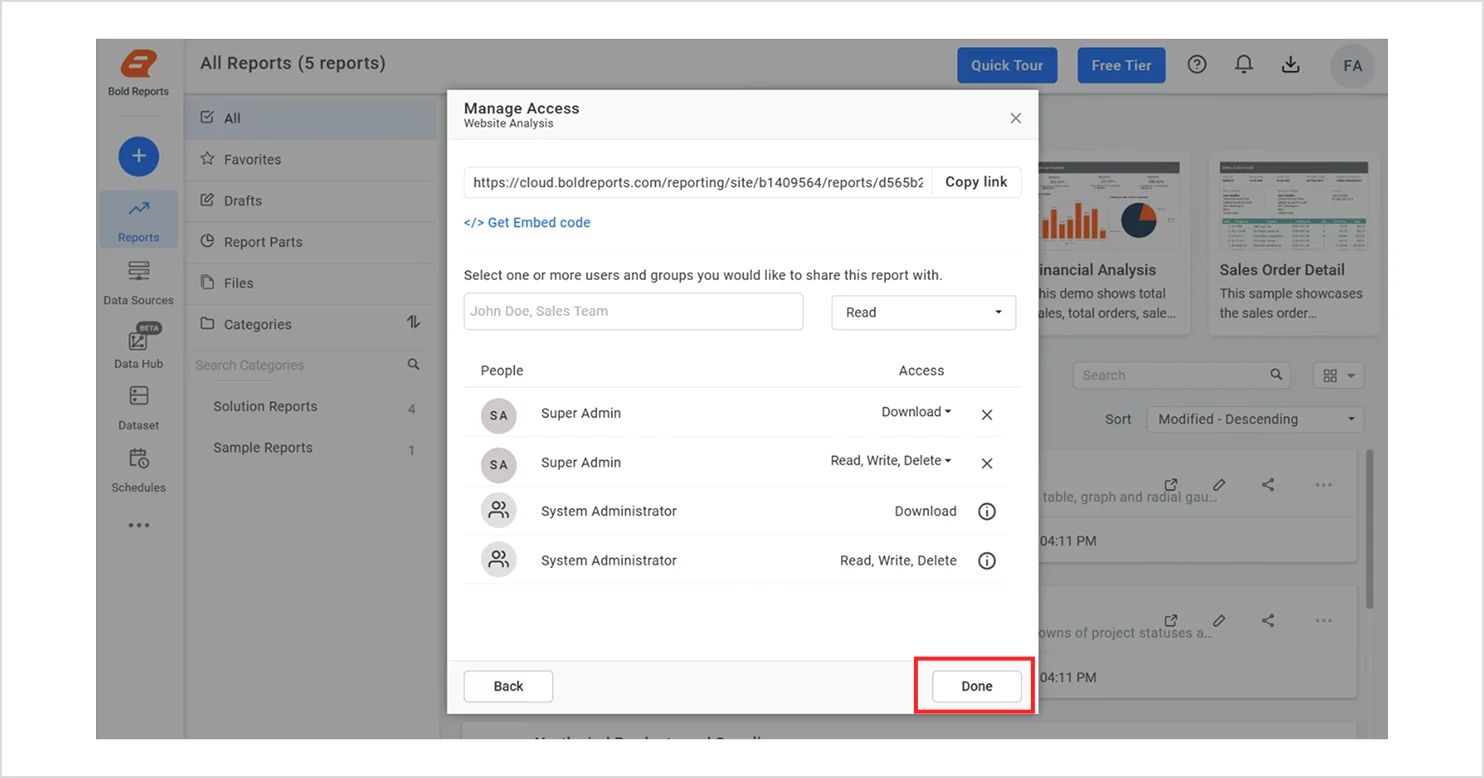
The RDL report will be shared with the selected users or groups, allowing them to access it based on the permission level you assigned. To learn more about managing permissions and sharing reports securely, refer to our documentation. You can also read our blog on collaborative reporting to understand how collaboration improves transparency and team productivity.
Next, let’s discuss how PostgreSQL data in Bold Reports can be used in real-time.
Real-world use cases of PostgreSQL data in Bold Reports
The following are real‑world examples of connecting PostgreSQL data to Bold Reports.
Marketing: Website visitor analysis report
This website visitor analysis report visualizes key traffic and audience metrics pulled directly from PostgreSQL. Without this report, teams would typically fall back on manual CSV exports and ad-hoc calculations to understand visitor behavior, which slows analysis, makes trend tracking harder, and increases the risk of miscounting visitors, misattributing sources, or drawing incorrect conclusions about what’s driving traffic and engagement.
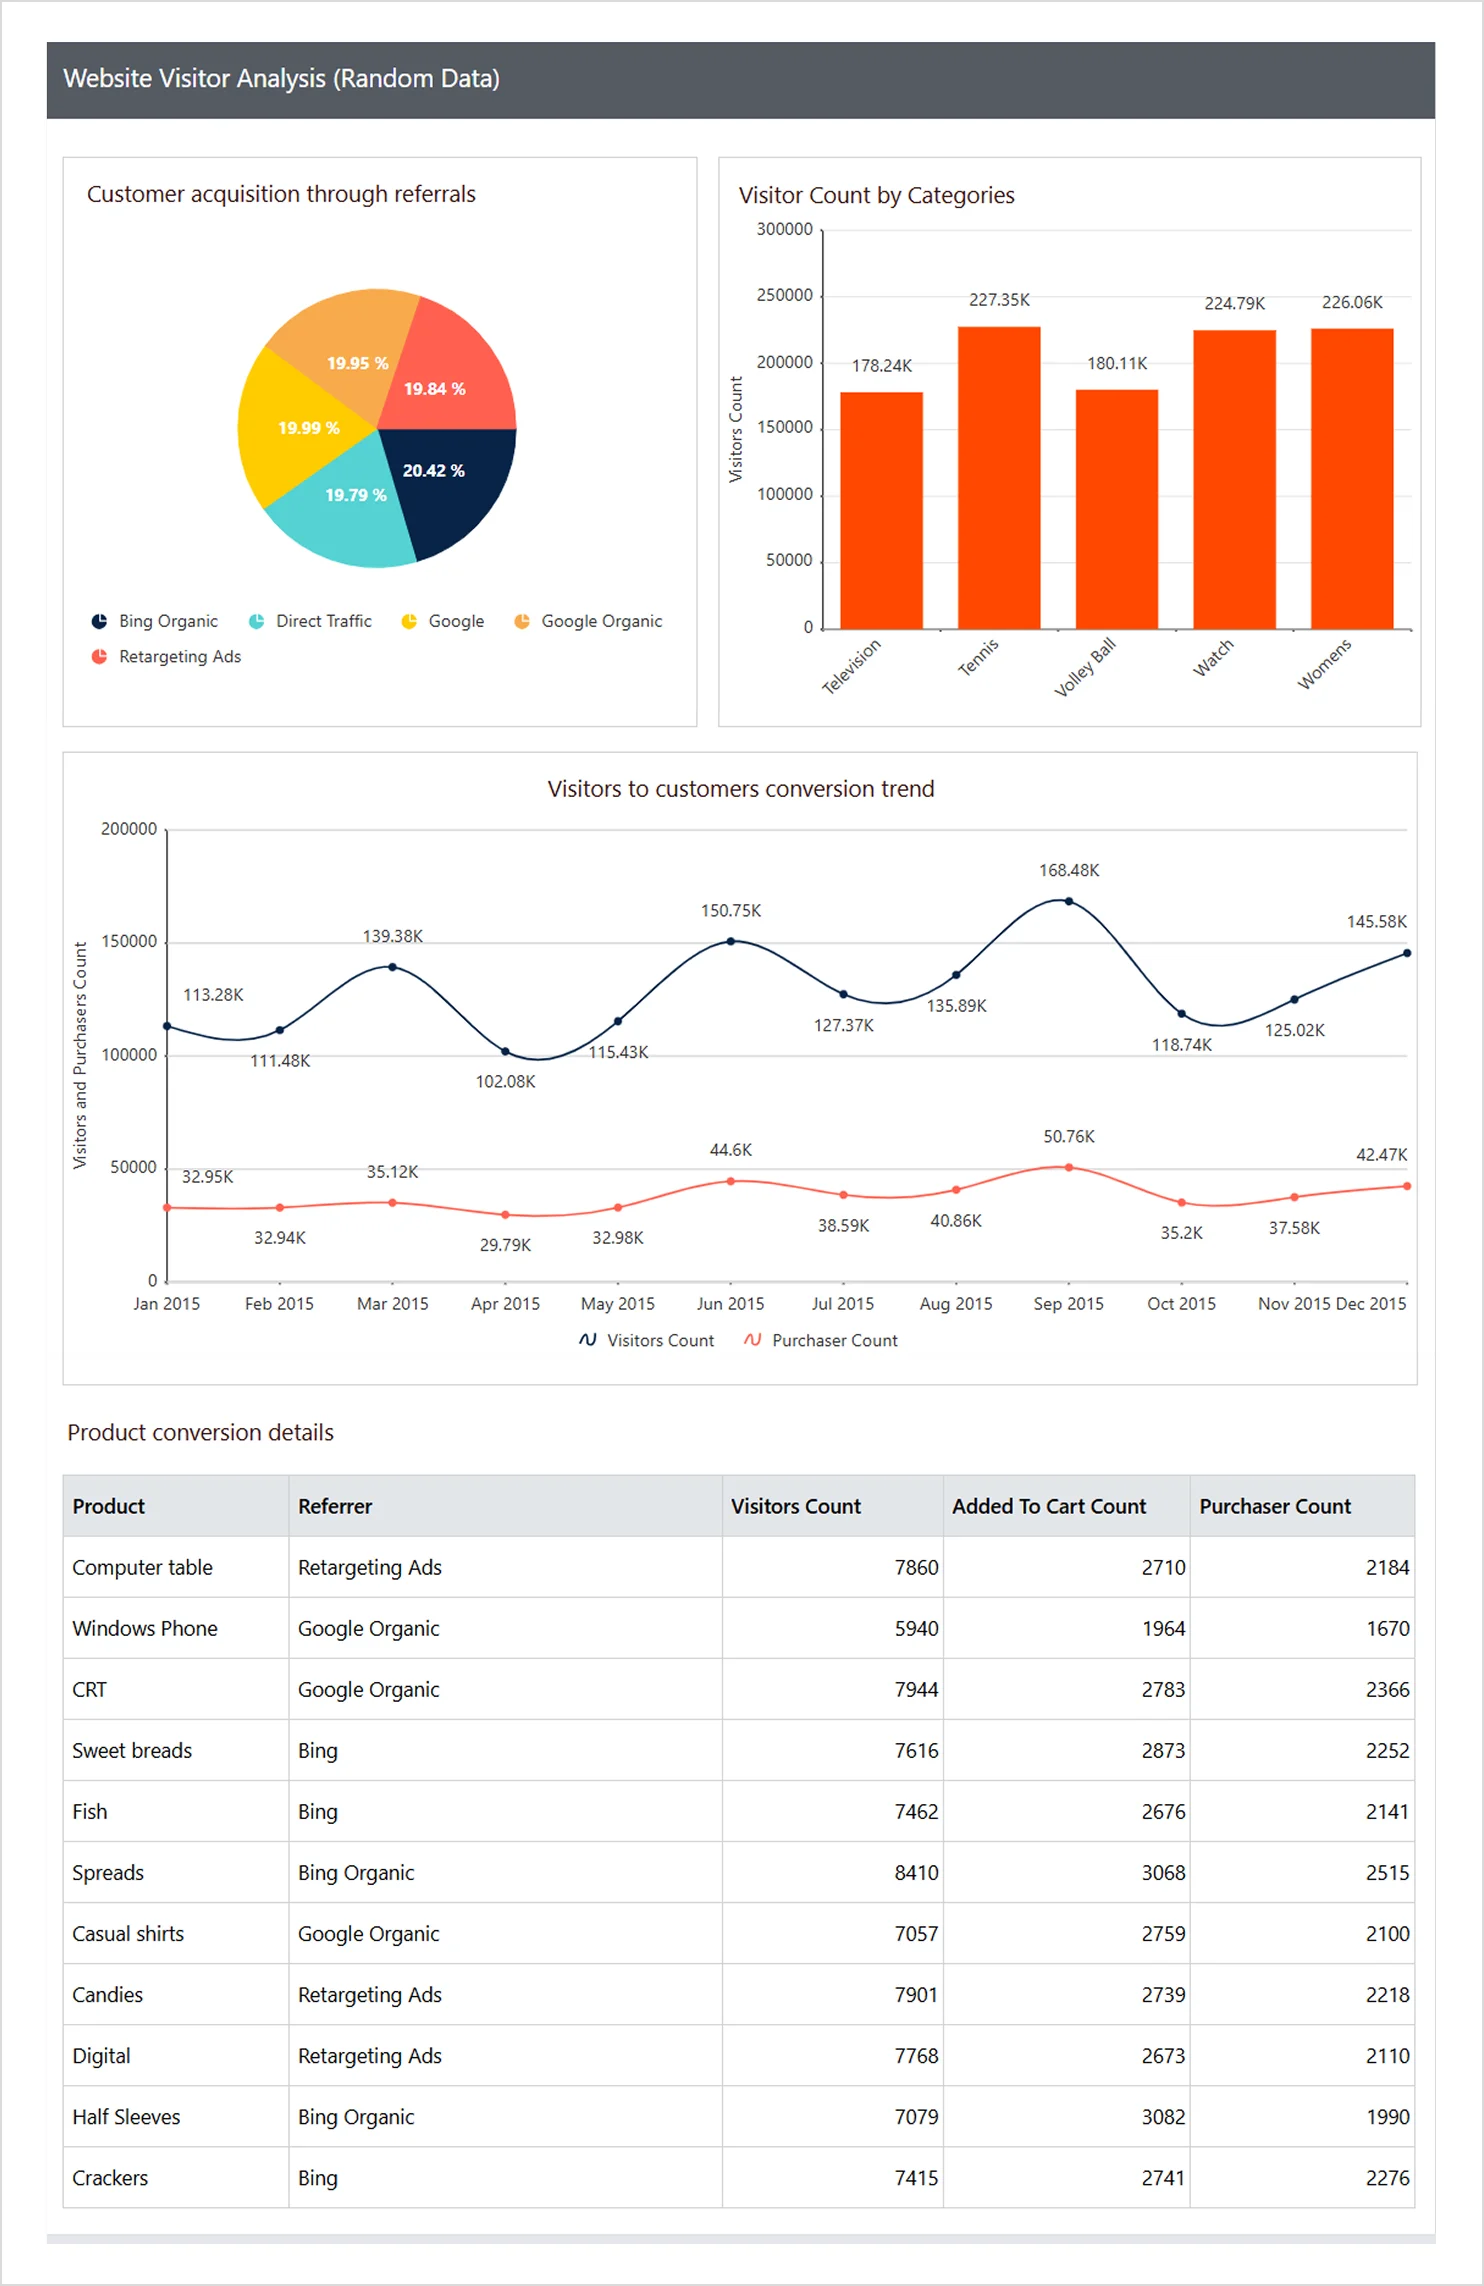
Website visitor analysis report
IT: Project overview reportIT platforms that rely on PostgreSQL to store project data, sprint activity, and resource usage can use Bold Reports to create and embed a project overview report. Such a report allows IT teams to view project metrics directly from their database without writing manual queries. As the data updates, the report reflects the latest project information automatically.
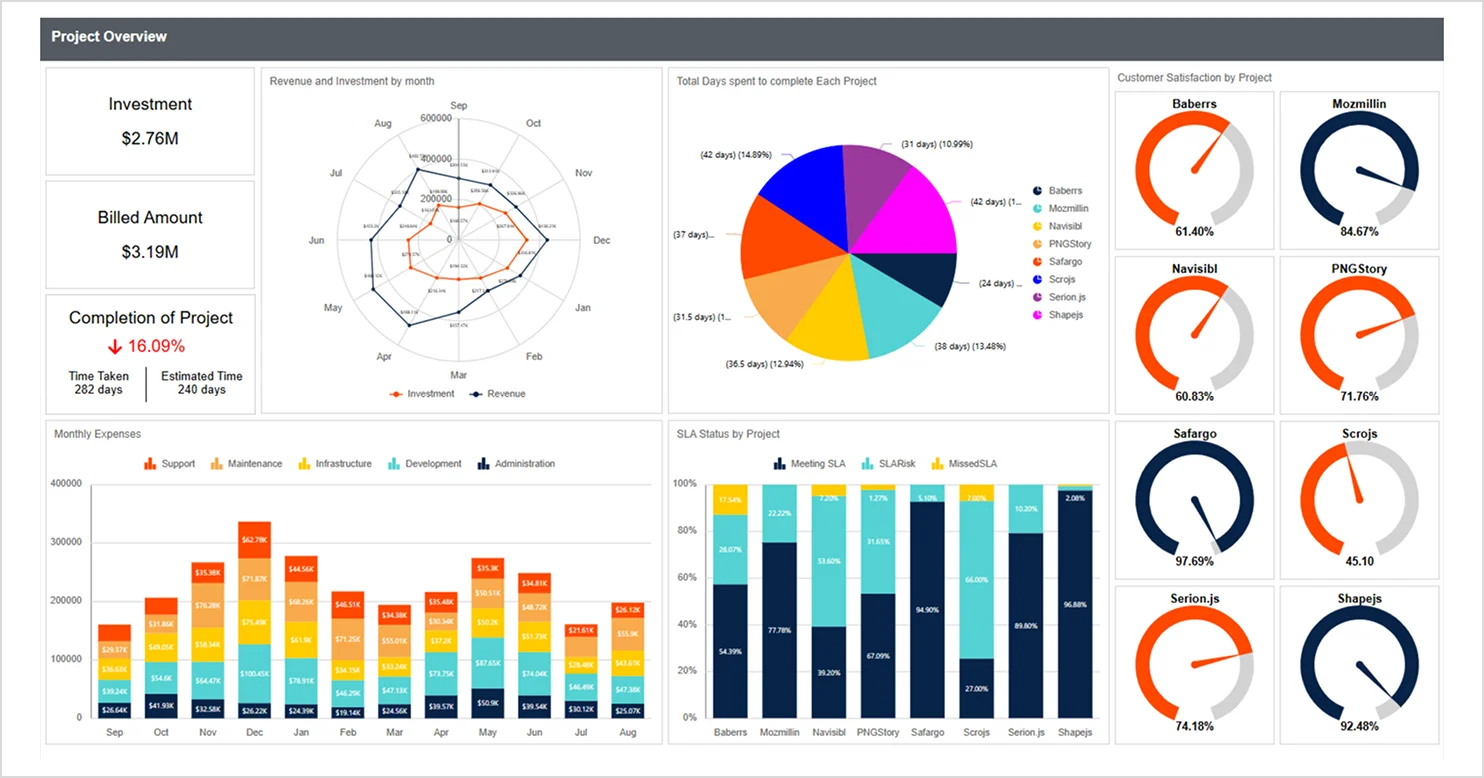
Project overview report
Best practices for connecting PostgreSQL data to RDL reports
To ensure your RDL reports remain fast, scalable, and easy to maintain, follow these recommended practices when sourcing data from PostgreSQL:
Use the Npgsql driver supported by Bold Reports for reliable PostgreSQL connections.
Use shared or parameterized connection strings so reports work in dev and production.
Store credentials in a shared data source to manage multiple reports in one place.
Put complex logic in PostgreSQL views to keep report queries clean and reusable.
Add indexes to columns you filter often to speed up report queries.
Conclusion
I hope this guide helped you clearly understand how to connect PostgreSQL data to an RDL report using Bold Reports®. By integrating your PostgreSQL database with RDL, you can eliminate manual data handling and generate accurate reports. With the right data source configuration, optimized queries, and best practices in place, developers and report designers can build scalable, pixel-perfect reports that support faster, data-driven decisions. Whether your PostgreSQL data is for operational reports, financial summaries, or product reports, visualizing it in RDL reports ensures consistency and high performance across your reporting environment.
Ready to try it yourself? Sign up for a free trial of Bold Reports, connect your PostgreSQL database, and start building dynamic RDL reports today.
Frequently asked questions
- Can you create SSRS‑style reports with PostgreSQL?
Yes, Bold Reports supports PostgreSQL through its data providers, enabling you to create SSRS‑style RDL reports while keeping the same familiar SSRS design workflow.
- Can Bold Reports connect directly to PostgreSQL?
Yes, the Bold Reports Designer supports PostgreSQL through its built-in connectors.
- Does Bold Reports support tenant-based PostgreSQL reporting?
Bold Reports can isolate datasets across tenants or clients within a single deployment.
- Can reports be customized visually?
Bold Reports provides extensive formatting, layout, and visualization features.
- Is Bold Reports cloud-ready?
You can deploy it on-premises or in cloud environments.
- Do I need advanced SQL skills?
Not necessarily. Bold Reports includes a visual query builder, although SQL can help with more complex logic.
- What export formats are available?
PDF, Excel, Word, CSV, PowerPoint, and more.


