5 Best Reporting Tools to Consider in 2025

Introduction
If you’re looking to invest in a reporting tool for your business, choosing the right one can be tough. With so many options available, it’s easy to feel overwhelmed by different features, prices, and promises. You need a tool that’s easy to use, fits your budget, and helps you make smart decisions with your data. This blog is here to help. We’ve put together a list of the five best reporting tools to consider in 2025. Each one is compared based on what it offers, how much it costs, and who it’s best for. By the end, you’ll have a clear idea of which tool suits your business needs.
9 features to look for when selecting a reporting platform
To choose the best reporting platform, you need to focus on the features that match your business goals and reporting needs. The right tool should offer the following nine features:
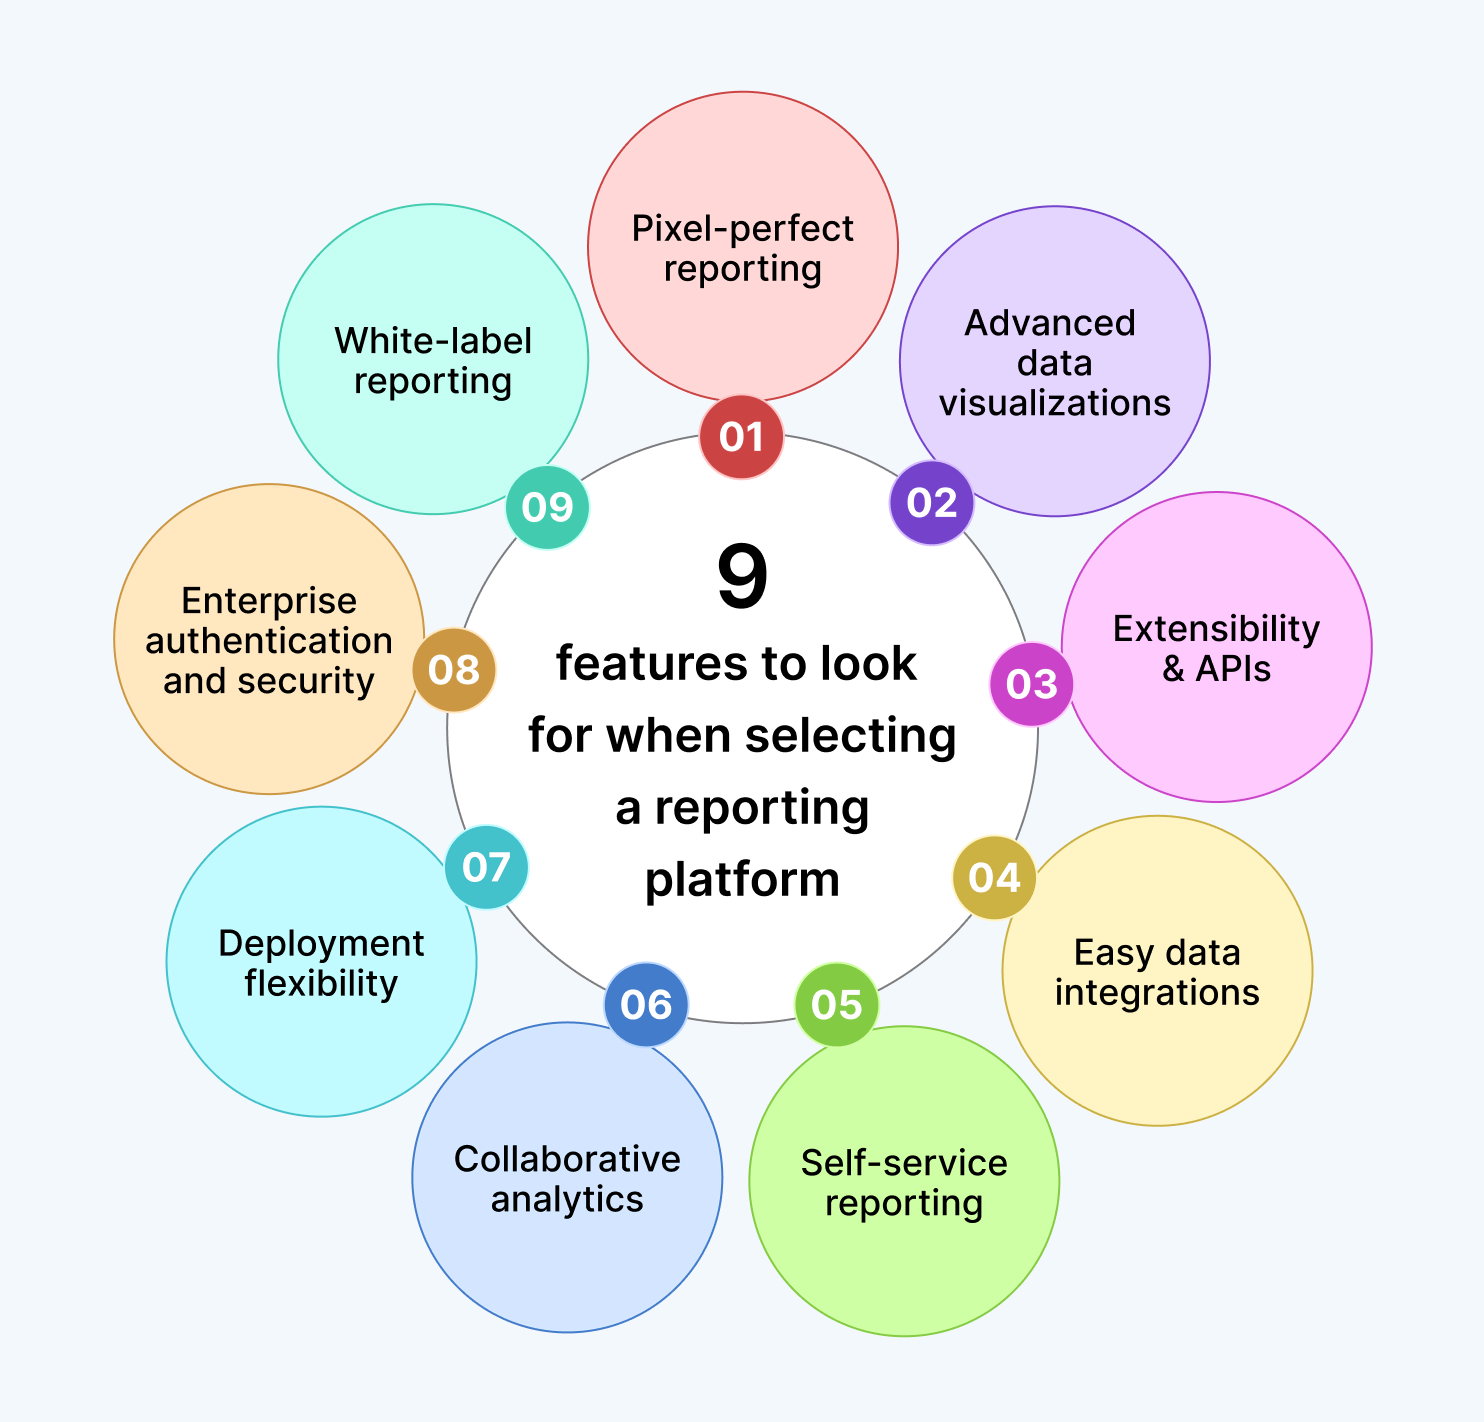
Pixel-perfect reporting: Choose a platform that allows for precise control over layout and formatting, ensuring your reports are professionally styled and print-ready down to the last detail.
Advanced data visualizations: Look for rich visualization capabilities such as interactive charts, graphs, and dashboards that make complex data easy to understand and act upon.
Extensibility and APIs: Look for platforms that allow customization through REST APIs, JavaScript hooks, and widgets. This helps tailor reports to your specific needs and automate workflows.
Easy data integrations: Ensure the platform connects easily to data sources like SQL, Oracle, Excel, and web This functionality saves time and reduces manual data handling.
Self-service reporting: A good platform should empower non-technical users to create and share reports without needing IT support, improving efficiency across teams.
Collaborative analytics: Features like sharing, exporting, and scheduled delivery help teams work together and keep everyone informed with up-to-date insights.
Deployment flexibility: Choose a platform that supports both cloud and on-premises deployment, depending on your infrastructure and data governance needs.
Enterprise authentication and security: Security is crucial. Look for support for SSO, OAuth 2.0, Active Directory, and other authentication methods to protect access.
White-label reporting: If branding matters, select a platform that allows you to customize the interface with your own logos, colors, and URLs.
Now that you know what to look for in a reporting platform, it’s time to explore the top tools to know which one offers all these features.
5 best reporting tools to consider in 2025
Bold Reports
Bold Reports is a modern reporting platform designed to deliver pixel-perfect and embedded reporting experiences for businesses of all sizes. It allows users to design highly detailed, print-ready reports with precise layouts and formatting—ideal for financial statements, invoices, and regulatory documents.
Key features of Bold Reports
Bold Reports offers a powerful suite of features that makes it the best investment for businesses seeking precise, secure, and scalable reporting solutions in 2025.
Standalone report designer: Bold Reports includes a built-in report designer that allows users to create and customize reports independently, without relying on external tools or developers. This gives teams complete control over layout, formatting, and report logic, while also helping to lower overall reporting expenses by eliminating the need for additional software or specialized personnel.
Effortless data integration: With Bold Reports, users can connect to multiple data sources by using the Bold Data Hub, which streamlines the process of transforming and aggregating data. This enables faster, more accurate reporting across diverse systems.
Rich data visualizations: Bold Reports makes it easy to build interactive, drag-and-drop reports with charts, filters, and custom visuals. These visualizations help users turn raw data into clear, actionable insights.
Flexible deployment and distribution: Bold Reports supports deployment on Windows, Linux, Docker, Kubernetes, and Azure, whether on-premises or in the cloud. It also enables embedding, white-labeling, and exporting reports in multiple formats to suit any workflow.
White-label reporting: Bold Reports allows full customization of report appearances to match your brand, including logos, colors, and themes. This ensures a consistent and professional experience for internal and external users.
Multitenant management: Bold Reports supports secure multitenant hosting, enabling organizations to manage multiple clients or departments on a single platform. Each tenant has isolated access and full administrative control.
Collaborative reporting: Bold Reports enhances teamwork by allowing users to share, comment on, and schedule reports with built-in collaboration tools. This keeps everyone aligned and informed with the latest data.
Advanced security and authentication: Bold Reports uses secure protocols like OAuth 2.0, OpenID Connect, and role-based access control to manage user permissions and safeguard sensitive data. It also meets key compliance standards such as GDPR, HIPAA, and SOC 2, ensuring robust enterprise-level security for organizations handling confidential information.
Affordable and transparent pricing: Bold Reports delivers pixel-perfect RDL and RDLC reports with straightforward, budget-friendly plans. Enjoy powerful reporting capabilities with no hidden fees.
Empowering self-service reporting: Bold Reports simplifies self-service reporting by enabling users of all skill levels to explore data and create reports independently. This reduces reliance on IT and accelerates decision-making across teams.
To learn more about the features of Bold Reports, explore our website.
Power BI
Power BI offers a comprehensive suite of tools that empower users to create, share, and embed interactive reports across desktop, web, and mobile platforms.
Key features of Power BI
Enterprise scale and self-service reporting: Empower users across all levels of your organization by blending centralized analytics with flexible self-service tools to illuminate insights and drive
Advanced data connectivity: Expand what your reports can do by connecting to hundreds of data sources and simplifying business processes across your organization.
Embedded BI reporting: Enhance user experience by embedding rich, interactive Power BI reports directly into your applications to boost usability and engagement.
Security and data governance: Manage reports confidently with built-in security and governance tools that support low-code solutions and grow with your organization’s needs.
Powerful reporting at a higher cost: Access powerful reporting features with flexible licensing options, but be mindful of rising costs for Pro licenses compared to more transparent pricing models offered by other platforms.
Tableau
Tableau is a powerful tool that delivers a flexible and secure reporting experience, making it ideal for users who need advanced data visualization across various environments. With its intuitive interface and robust capabilities, Tableau helps organizations turn complex data into actionable insights.
Key features of Tableau
Interactive data exploration: Explore data visually and intuitively, enabling faster insights through dynamic dashboards and drill-down capabilities.
Trusted data governance: Maintain control and accuracy with advanced governance tools that support secure, compliant data management across teams.
Flexible deployment options: Deploy Tableau on local infrastructure, public clouds, or private clouds to suit your organization’s infrastructure and scalability needs.
AI-powered insights: Unlock deeper insights with AI-driven analytics built directly into Tableau Server—no data scientists
Advanced tooling and higher costs: While Tableau offers powerful capabilities, users should be prepared for a steeper learning curve and higher licensing costs compared to simpler tools.
Looker
Looker offers a modern, cloud-native business intelligence platform that empowers users with governed data modeling, flexible integrations, and scalable analytics built on Google Cloud.
Key features of Looker
Centralized data modeling with LookML: Define and manage business rules using LookML, a SQL-based modeling language. While this is a powerful feature, it does require users to possess some technical knowledge.
Version-controlled data logic: Maintain consistency and control with Git-integrated versioning, allowing teams to collaborate and innovate without compromising data integrity.
Integrated with Looker Studio: Connect governed data models to Looker Studio for seamless reporting and visualization, combining ad hoc flexibility with trusted data.
Built on Google Cloud: Access and manage Looker directly from the Google Cloud Console to benefit from native integration with other Google Cloud services.
Self-service and embedded BI: Empower users to explore data independently or embed analytics into custom applications, supporting both self-service and developer-driven use cases.
Sigma
Sigma is a cloud-native analytics platform that combines the familiarity of spreadsheets with the power of real-time, secure data exploration, making it ideal for business users and data teams alike.
Features of Sigma
Code-free data modeling: Define relationships and metrics without writing code, while adding human context and writing data directly to your cloud warehouse.
Advanced data visualizations: Transform complex datasets into clear insights using Sigma’s extensive library of charts and graphs.
Instant drill-down analysis: Explore any field instantly with drill-anywhere functionality, enabling deeper insights without predefined paths.
Automated report delivery: Use export bursting to schedule and send tailored reports to the right stakeholders automatically.
Enterprise-grade security and governance: Maintain precise control with granular permissions, real-time governance, and full compliance—your data stays secure and never leaves the warehouse.
With these reporting solutions, your data journey doesn’t have to be complicated. Simply choose the one that best suits your business needs and budget, and you’ll be well on your way to making smarter, faster decisions.
Explore why Bold Reports stands out
As businesses continue to prioritize data-driven decision-making in 2025, choosing the right reporting tool is more important than ever. While Power BI, Tableau, Looker, and Sigma each offer valuable capabilities, Bold Reports stands out for its ability to deliver precise, secure, and scalable reporting experiences at a very affordable price point.
It’s an all-in-one, user-friendly platform designed to help teams design, manage, and deliver professional reports with ease. With its intuitive drag-and-drop report builder, pixel-perfect design control, and effortless SSRS RDL migration, Bold Reports saves time and empowers users of all skill levels. Whether you need self-service reporting or embedded analytics, it offers tailored experiences to fit your workflow.
Want to get started? You can sign up for a 30-day free trial or request a personal demo. If you’re just getting started with Bold Reports, schedule an onboarding call to see how Bold Reports can support your reporting goals.


